The St. Louis Metro residential real estate market in 2024 is showcasing diverse trends, indicating an evolving landscape for buyers, sellers, and industry professionals. The latest data, detailed in the STL Market Report exclusively from MORE, REALTORS®, offers a snapshot of these dynamics.
Contrasting Sales Trends:
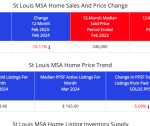
There’s a notable decrease in home sales volume by 16.11% in the past year, with figures declining from 38,173 to 32,022 homes sold.
Home Value Resilience:
Despite the lower sales volume, median sold prices in the metro area nudged upward by 2.44%, moving from $246,000 to $252,000 year-over-year.
Price Per Square Foot (PPSF) Analysis: