By Karen Moeller, on February 16th, 2026 
Recent national housing headlines have sounded familiar. Foreclosure activity has increased across the country, with ATTOM Data Solutions reporting annual gains for eleven consecutive months. For many buyers, especially those who remember the late-2000s housing crisis, the reaction is immediate. If foreclosures are rising, bargains must be coming. In St. Louis, that conclusion rarely follows.
ATTOM’s data confirms filings have risen year over year, but they are increasing from historically suppressed pandemic-era levels rather than from a distressed market baseline. The Mortgage Bankers Association delinquency survey and Federal Reserve mortgage delinquency rates show the same pattern. Continue Reading →
By Karen Moeller, on February 8th, 2026 
There’s a moment almost every first-time landlord has. It usually happens right after the first rent check clears. They lean back and think, This is great. Why didn’t I do this sooner?
Fast forward a few months and they’re in the basement with a flashlight in their mouth, halfway through a YouTube video titled “Easy 5-Minute Pipe Fix,” wondering how a tiny drip just turned into a much bigger problem.
Rental ownership is often sold as passive income. In reality, it’s a small business with safety rules, maintenance standards, inspections, permits, and real liability. Collecting rent is the fun part. Continue Reading →
By Karen Moeller, on January 22nd, 2026 
Few phrases in real estate create more confusion than “As-Is.”
Buyers often see it as a warning label.Sellers sometimes view it as a shield.In reality, it is neither.
I regularly hear buyers say they will not even consider a home once they see “As-Is” in the listing. I also frequently hear buyers assume that “As-Is” means the seller is desperate or that the property can be purchased for pennies on the dollar. That expectation rarely aligns with reality. In most cases, the seller has already considered the condition of the home and priced it Continue Reading →
By Dennis Norman, on December 6th, 2025 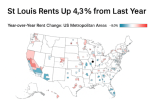
While rents have declined nationally over the past year, St. Louis is one of the exceptions. According to the December 2025 National Rent Report from Apartment List, the St. Louis metro saw a 4.3% year-over-year increase in rent prices, placing it among the top ten large U.S. metro areas for rent growth.
The national picture looks very different. Rents fell by 1.0% in November alone and are now down 1.1% compared to the same time last year. This marks the fourth straight month of nationwide rent declines. In fact, national median rent has dropped 5.2% from its August 2022 peak Continue Reading →
By Dennis Norman, on December 6th, 2025 
Real estate investors accounted for a record-high 33% of all single-family home purchases in the U.S. during the second quarter of 2025, according to the latest Investor Pulse™ Report from BatchData. This marks the highest share in five years and reflects a growing trend of investor activity in the housing market, particularly from “mom-and-pop” buyers who now own over 90% of all investor-held homes. In contrast, large institutional investors have been net sellers for six straight quarters. Despite this national trend, Missouri’s investor footprint remains relatively modest, coming in just under the national average, based on visual analysis of the Continue Reading →
By Karen Moeller, on November 11th, 2025 
When an out-of-state investor hired a St. Louis property management company to handle her “passive income” portfolio, she pictured auto-deposits and serenity. Instead, she got unpaid utilities, tenants who’d gone AWOL, deferred maintenance, and an electrical shut-off on inspection day. (There’s nothing like meeting your buyer by flashlight to remind you how active “passive income” can get.)
Sound familiar? You’re not alone. Roughly one in five St. Louis rental properties is owned by someone who lives outside Missouri — and too many assume “property management” means “set it and forget it.” Spoiler: it doesn’t.
When Property Managers Drop the Ball Continue Reading →
By Dennis Norman, on October 30th, 2025 
A pending bill in the Illinois Senate, HB3564, aims to limit rental fees and increase transparency, but it raises real concerns for landlords and property managers. While I’m fully in favor of transparency and clear disclosure of fees, this bill adds unnecessary restrictions that could reduce housing availability and create inequities in how different types of tenants are treated.
The bill would prohibit landlords from charging move-in fees on top of security deposits and would require that any non-optional fees be listed on the first page of the lease. It also limits background check fees to the **actual cost or Continue Reading →
By Karen Moeller, on September 19th, 2025 
If you’ve ever sat through a weekend “get rich with real estate” seminar, you’ve probably heard this pitch: St. Louis is the affordable Midwest market with strong cash flow, stable renters, and easy entry points.
And for many investors, that sounds like the perfect recipe for a better retirement, a nest egg for the family, or a shot at financial freedom.
But here’s the truth: without the right guidance, St. Louis can turn from opportunity into nightmare—fast.
This is the real story of one out-of-state investor who trusted the hype, bought “off market” without local representation, and walked straight into Continue Reading →
By Dennis Norman, on July 3rd, 2025 
According to ATTOM’s Q1 2025 U.S. Home Flipping Report, home flipping remained an active segment of the real estate market in both Missouri and Illinois, although investor performance varied. In Missouri, 1,576 homes were flipped during the quarter, representing 11.0% of all home sales—well above the national average. Flippers in Missouri earned a median gross profit of $36,000, which translated to an 18.0% return on investment (ROI). Meanwhile, Illinois saw higher profitability with 2,001 flips and a 6.5% flipping rate. The median gross profit for Illinois investors reached $85,981, yielding a strong ROI of 52.8%. While Illinois investors had to Continue Reading →
By Dennis Norman, on June 20th, 2025 
St. Louis stood out as one of the top-performing rental markets in the nation in early 2025, with single-family rents rising 6.1% year-over-year through March. That’s the second-highest increase among the 50 largest U.S. metros and well above the national average of 4.1%, according to the Q2 2025 Arbor Single-Family Rental Investment Trends Report:contentReference[oaicite:0]{index=0}.
This growth comes despite national trends showing a slowdown in rent escalation and a slight dip in occupancy. Occupancy rates for single-family rentals nationwide averaged 93.7% in Q1 2025, marking the fourth straight quarterly decline. Retention rates, however, are on the rebound after dropping from a Continue Reading →
By Dennis Norman, on June 20th, 2025 
According to the just-released Independent Landlord Rental Performance Report – June 2025 from Chandan Economics, Missouri finds itself far from the top in terms of on-time rental payments. The national on-time payment rate dropped to 84.3%, down 85 basis points from the month before, while the forecast full-payment rate slid to a post-pandemic low of 94.0%. While western states like Montana (93.5%) and Utah (92.3%) led the nation, Missouri did not crack the top 10 — or even top 20 — states for on-time rent performance. This matters for St. Louis landlords and property managers who rely on timely rent Continue Reading →
By Dennis Norman, on May 15th, 2025 
According to ATTOM’s just-released April 2025 U.S. Foreclosure Market Report, foreclosure activity across the U.S. continues to rise gradually. A total of 36,033 properties had a foreclosure filing last month, which includes default notices, scheduled auctions, or bank repossessions. This marks a 0.4% increase from March and a 13.9% jump from April 2024. Rob Barber, CEO of ATTOM, commented that while foreclosure volume is still below historical norms, “the year-over-year increases may suggest that some homeowners are beginning to feel the effects of persistent economic pressures.”
In the Midwest, Illinois stood out with one of the highest foreclosure rates in Continue Reading →
By Dennis Norman, on April 27th, 2025 The latest Independent Landlord Rental Performance Report from Chandan Economics, covering April 2025, shows on-time rental payments nationally hitting 86.3% — an improvement of 45 basis points from the prior month, and notably the first year-over-year increase in on-time payments since July 2023. While this is encouraging news overall for small to medium landlords, the story for Missouri and Illinois isn’t quite as rosy when you dig into the state-level data.
Missouri posted an on-time payment rate of just 83%, putting us at 42nd out of the 47 states and districts that met reporting Continue Reading →
By Dennis Norman, on April 14th, 2025 
A recent survey from Knightvest Capital highlights a clear shift in the mindset of today’s renters—nearly half (48%) now view renting as a deliberate lifestyle choice rather than just a financial necessity. Even more telling, 42% of renters say they expect to remain tenants for five years or more. It’s a strong indication that the flexibility, lower maintenance, and built-in community aspects of renting are becoming more appealing—especially when compared to the demands of homeownership.
One of the more surprising takeaways from the report is that nearly a third (31%) of current renters previously owned a home. That tells Continue Reading →
By Dennis Norman, on February 21st, 2025 
Zombie foreclosures—homes abandoned during the foreclosure process—remain a rare issue nationwide, according to ATTOM’s latest Q1 2025 report. Nationally, only one in every 14,700 homes sits vacant due to foreclosure, holding steady from last quarter and slightly improved from a year ago. While overall foreclosure activity has declined for five consecutive quarters, the share of zombie foreclosures remains a fraction of the U.S. housing market.
In Missouri, the number of zombie foreclosures rose 85% over the past year, from 27 to 50 homes, while St. Louisrecorded an 8.9% zombie foreclosure rate among properties in foreclosure. Peoria, Continue Reading →
By Dennis Norman, on October 25th, 2024
The on-time payment rate for single-family rentals dropped to 85.3% in August 2024, marking its lowest point since September 2021, according to the chart below from Chandan Economics. This decline reflects a potential shift in tenants’ financial situations, as the rate had generally been stable over the past two years. Landlords, especially independent operators, may now face increased challenges maintaining cash flow as timely rental payments become less consistent.
The chart below highlights the historical fluctuations in rental payment punctuality, showing that single-family rental payments were on a recovery trend from earlier dips in 2020 and 2021. However, the latest Continue Reading →
By Dennis Norman, on July 19th, 2024 
President Biden’s recent proposal for a 5% corporate rent cap has stirred significant debate among housing experts. The Housing Solutions Coalition (HSC) has criticized the plan, labeling it as “typical election year rhetoric” and warning that rent caps exacerbate housing shortages, leading to higher rents and lower quality housing. They argue that the nation’s massive housing deficit requires solutions that prioritize building more housing, not restricting development.
The HSC advocates for regulatory and financial incentives for home builders and multifamily owners/operators, along with increased subsidies for low-income families. They contend that these measures would effectively address affordability issues, whereas rent Continue Reading →
By Dennis Norman, on May 1st, 2024 According to the latest Independent Landlord Rental Performance Report by Chandan Economics, April 2024 witnessed a decline in on-time rental payments in independently operated rental units nationwide, dropping to 85.2%. As illustrated by the chart below, this marks a decrease from 87.0% the prior month and 87.8% a year ago. Western states, notably Utah, Alaska, and Colorado, continue to lead the nation with the highest on-time payment rates. However, it’s worth noting that here in Missouri, only 82% of tenants paid their rent on time in April, resulting in Missouri ranking 43rd in the country for on-time rent payments.
Continue Reading →
By Dennis Norman, on April 17th, 2024 
Based on the data from the recent ATTOM report on U.S. commercial foreclosures, there is a noticeable trend that highlights the challenges and changes in the commercial real estate market over the past decade. The report indicates a significant increase in commercial foreclosures, rising to 625 in March 2024 from a low of 141 in May 2020—a time characterized by pandemic-induced economic shocks and responsive fiscal interventions. This sharp rise represents a 117% year-over-year increase and underscores a broader economic narrative where, despite short-term stabilizations, long-term market corrections have been a constant presence.
States like California, New York, and Florida Continue Reading →
By Dennis Norman, on February 2nd, 2024 The latest residential vacancy rate data from the U.S. Census Bureau for the St. Louis Metropolitan Statistical Area (MSA) shows that the rental vacancy rate for 2023 was an average of 7.73% and increase of over a percentage point from the previous year. As the chart below illustrates, the average St Louis rental vacancy rate for 2023 was the highest in four years.
Search St Louis Homes For Sale Search St Louis Foreclosed Homes For Sale
St Louis MSA Rental Vacancy Rate 2015-2023
Continue Reading →
By Dennis Norman, on January 12th, 2024 The St. Louis MSA has seen a notable decrease in foreclosure filings in the fourth quarter of 2023, with the numbers falling to 851, a 19% reduction from the previous quarter. When we look at the year-over-year data, the decline is even more significant, showing a 46% drop from the fourth quarter of 2022. This downward trend suggests a potentially stabilizing real estate market in the St Louis metro area, with fewer properties entering foreclosure.
Within this broader picture, certain counties have experienced remarkable changes. Monroe County, for instance, recorded a sharp increase of 60% in foreclosure filings from Q3, Continue Reading →
By Dennis Norman, on November 14th, 2023 The St. Louis MSA recorded 311 foreclosure actions in October 2023. This represents a significant decrease of 12% from September 2023 and a substantial decline of 71% compared to October 2022. This suggests a strong recovery or stabilization in the real estate market in the St. Louis area, indicating fewer homeowners are facing foreclosure compared to the previous year.
Search St Louis Homes For Sale Search St Louis Foreclosed Homes For Sale
Month over Month and Year Over Year Change in Foreclosure Activity in the St Louis MSA (By County)
Continue Reading →
By Dennis Norman, on November 10th, 2023 In the ever-evolving landscape of real estate transactions, the threat of fraud has become increasingly sophisticated and pervasive. Recent alerts from Westcor and other title insurance underwriters highlight a worrying trend in real estate fraud, impacting not just foreign-owned unimproved lots but also residential and commercial properties across the board. As a leading voice in the St. Louis real estate market, it’s crucial to address these concerns and reinforce the importance of vigilance among our agents and clients.
Search St Louis Homes For Sale Search St Louis Upcoming OPEN HOUSES
The Escalating Threat of Real Estate Fraud
Seller Impersonation: Continue Reading →
By Dennis Norman, on October 12th, 2023 During the 3rd quarter of this year, there were 1,200 properties with foreclosure filings in the St. Louis MSA, according to the U.S. Foreclosure Market Report by ATTOM Data. This marks a 17% increase in St. Louis foreclosures from the prior quarter and an increase of 32% in St Louis foreclosure activity from a year ago.
The table below reveals that the city of St Louis saw the most foreclosures during 3rd quarter, followed by the Illinois counties of St Clair and Madison.
Search St Louis Homes For Sale Search St Louis Foreclosed Homes For Sale
St Louis Continue Reading →
By Dennis Norman, on September 23rd, 2023 With changing regulations, subdivision restrictions, municipal ordinances, state and federal laws, landlords certainly have a lot to keep up with today to make sure they stay compliant in their rental business. I’ve been in the business over 40 years, have an interest-and a fair understanding of- laws that affect real estate, yet still find it challenging to stay updated. Given this, I can only imagine the challenge faced by someone with a full-time career who also owns rental properties as an investment. Perhaps, this might be a compelling reason to consider hiring a professional property manager for your rentals. However, Continue Reading →
By Dennis Norman, on September 22nd, 2023 There were 788 homes and condominiums “flipped” during the second quarter of this year in the St Louis M.S.A., according to data just released by ATTOM Data Solutions. As the infographic below illustrates, these flips represent 8.7% of all sales during the quarter, a decrease of 23.9% from the prior quarter and a decline of over 22% from a year ago.
Search St Louis Homes For Sale Search St Louis Upcoming OPEN HOUSES
St Louis Home Flipping Report Q2 2023
(click on infographic to see complete report including prices and profits)
Continue Reading →
By Dennis Norman, on August 22nd, 2023 Last month, city of St Louis mayor, Tishaura Jones, signed into law a new ordinance which provides “access to legal representation for tenants facing eviction or equivalent proceedings”. Surprisingly, it does not appear that the tenant needs to show a final hardship or need for “full legal representation” to be provided at no cost as the bill defines a “covered individual” as “any residential tenant who occupies a dwelling located within the City under a claim of legal right, other than the legal property owner of the dwelling.” Another interesting thing in the ordinance is that it appears to include Continue Reading →
By Dennis Norman, on July 13th, 2023 So far this year, up until June 30, there have been 1,973 properties with foreclosure filings in the St. Louis MSA, according to the U.S. Foreclosure Market Report by ATTOM Data. This marks a 5% increase in St. Louis foreclosures compared to the same period last year, a surge of 119% from 2021, and a 5% uptick from 2020.
Now, let’s turn our attention to the counties in Illinois with the most significant increases in foreclosures: Macoupin and Bond…
As depicted in the table below, Macoupin County in Illinois experienced a 63% rise in foreclosure activity this year compared to Continue Reading →
By Dennis Norman, on June 8th, 2023 Last month, there were 460 properties with foreclosure filings in the St Louis MSA, according to ATTOM Data’s U.S. Foreclosure Market Report. This represents an increase of 36% in St Louis foreclosures from April 2023 to May 2023 and a 28% increase from a year ago.
Counties of Macoupin, St Charles and St Louis see biggest increases…
As the table below shows, Macoupin County in Illinois saw an increase of 113% in foreclosure activity in May from the month before, St Charles County a 71% increase and St Louis County a 67% Increase.
[xyz-ips snippet=”Foreclosures-For-Sale-and-Homes-For-Sale”]
St Louis Foreclosures – May Continue Reading →
By Dennis Norman, on March 9th, 2023
A new report just released by ATTOM Data revealed that nearly one of every four homeowners (24.3 %) in the city of St Louis that have a mortgage, are underwater on equity (meaning property owner owes at least 25% more on their home than the current value). At the other end of the spectrum was St Charles County where just 3.9% of homeowners with a mortgage are underwater.
Below is a list of the larger counties in the St Louis MSA and the percentage of the mortgages in the respective county that was underwater during the 4th Continue Reading →
|
Recent Articles
Helpful Real Estate Resources
|

