By Dennis Norman, on June 26th, 2015 St Louis area homes are already affordable based upon the relationship between the median home price and median income for the area, but can become even more affordable when home buyers take advantage of down payment assistance programs that are available throughout the area.
Housing affordability is still good in spite of rising prices-
Data for April, from RealtyTrac, shows house payments on a median priced home in St Louis County required 23% of median income and in St Charles County required just 21% of median income while the national average was 23%. Even with the hot market we have been in, and rising home prices in St Louis, affordability for April in both St Louis County and St Charles County were still lower than their historic norms of 24% and 22% respectively.
Downpayment assistance programs make homes even more affordable –
There are several (over 50) down payment assistance programs in Missouri with many of them available in the St Louis area. To see a complete list of downpayment assistance programs available, along with complete program information, visit Downpayment Assistance Programs For Missouri. To give you an idea of the type of assistance that is available, below is some data from buyers that received down payment assistance in the St Louis area in April 2015:
- In St Louis County the average down payment help benefit received was $6,125.00 which represented 3.53% of the median sales price.
- In St Charles County the average down payment help benefit received was $5,000.00 which represented 2.5% of the median sales price.
- There are 24 down payment help programs available to people buying homes in St Louis County and 16 programs averrable to people buying in St Charles County.
(We work hard on this and sure would appreciate a “Like”)[iframe http://www.facebook.com/plugins/like.php?href=https%3A%2F%2Fwww.facebook.com%2FStLouisRealEstateNews&send=false&layout=standard&width=50&show_faces=false&font&colorscheme=light&action=like&height=35&appId=537283152977556 100 35 ]
Search St Louis Homes For Sale HERE
See ALL Homes That Will Be Open In St Louis This Weekend
Complete Information On Over 50 Down Payment Assistance Programs Available In Missouri
By Dennis Norman, on June 18th, 2015 St Louis foreclosure activity in May 2015 continued the downward trend with a drop of almost 9 percent from the month before for the St Louis MSA as a whole, according to data just released this morning by RealtyTrac. As the table below shows, foreclosure activity in May was up over 55% from May 2014, however, when we look at the 12 month rolling average, which gives a better indication of the trend (blue area in table) we see that for the 12 month period ended in May foreclosure activity is down over 13% from the same time a year ago.
Franklin County is the exception to the good news…
Franklin county, on the other hand, saw a big jump in foreclosure activity during May with action on 29 properties during the month, a decline from the month before, but a whopping 625% increase from a year ago. The twelve month rolling average for Franklin County shows May 2015 was up 219% from May 2014. In spite of this huge increase in foreclosure activity, Franklin County still has one of the lower foreclosure rates in the St Louis, MO area, in terms of number of foreclosures per total housing units, with just 1 foreclosure action for every 1,498 housing units.
(We work hard on this and sure would appreciate a “Like”)[iframe http://www.facebook.com/plugins/like.php?href=https%3A%2F%2Fwww.facebook.com%2FStLouisRealEstateNews&send=false&layout=standard&width=50&show_faces=false&font&colorscheme=light&action=like&height=35&appId=537283152977556 100 35 ]
Search St Louis Foreclosures For Sale HERE
Search St Louis Homes For Sale HERE
Continue reading “St Louis Foreclosure Activity Trends Downward In Most Areas But Franklin County Spikes Upward“
By Dennis Norman, on June 12th, 2015 During the 2nd quarter of this year, there was foreclosure activity on one out of every 887 housing units in Jefferson County, giving it the highest foreclosure rate of the main counties making up the St Louis real estate market, according to a report just released by RealtyTrac. St Charles County, with foreclosure activity on just 1 of every 1,620 housing units, had the lowest foreclosure rate for 2nd quarter of 2015.
From a housing density standpoint, St Charles County was number one with 2.56 people per housing unit and the City of St Louis had the least density with just 1.82 people per every housing unit.
(We work hard on this and sure would appreciate a “Like”)[iframe http://www.facebook.com/plugins/like.php?href=https%3A%2F%2Fwww.facebook.com%2FStLouisRealEstateNews&send=false&layout=standard&width=50&show_faces=false&font&colorscheme=light&action=like&height=35&appId=537283152977556 100 35 ]
Search St Louis Foreclosures For Sale HERE
Search St Louis Homes For Sale HERE

By Dennis Norman, on June 11th, 2015 That’s right, Zombies are very real and very present in St Louis…at least Zombie foreclosures that is! That’s right. According to a foreclosure zombie report just released this morning by RealtyTrac, St Louis made the list of “Top 10 Zombie Foreclosure Rates Among Major Markets”, coming in at number 6 on the list with 1 of every 1,627 housing units being a zombie foreclosure. In the number 1 spot on the list was Tampa Florida where 1 of every 217 housing units is a zombie foreclosure (the complete list, and infographic, is below).
What is a Zombie Foreclosure?
Yet another new term that is common place in the real estate community now, but was not 10 years ago, is “Zombie Foreclosure”. This term has been applied to homes whereby the homeowner is in default on their mortgage and headed to foreclosure but vacates the home prior to actually losing it in foreclosure. This often results in the property becoming blighted while going through the process, and until the bank obtains ownership of the home, as no one is there taking care of it and the owner has given up. Zombies are not good for neighborhoods nor home values of the surrounding homes.
(We work hard on this and sure would appreciate a “Like”)[iframe http://www.facebook.com/plugins/like.php?href=https%3A%2F%2Fwww.facebook.com%2FStLouisRealEstateNews&send=false&layout=standard&width=50&show_faces=false&font&colorscheme=light&action=like&height=35&appId=537283152977556 100 35 ]
Search St Louis Foreclosures For Sale HERE
Search St Louis Homes For Sale HERE
Continue reading “St Louis Makes List Of Top Ten Metros In U.S. For Rate Of Zombies“
By Dennis Norman, on May 28th, 2015 The city of St Louis came in at the top of list of RealtyTrac’s “Top Buyer’s Markets“, just released this morning. For the report, RealtyTrac analyzed average sales prices and estimated market values at time of sale for homes and condos sold in April in 315 U.S. counties to come up with a list of the Top Seller’s Markets and the Top Buyer’s Markets. For the city of St Louis, the analysis revealed, as the chart below illustrates, that in April 2015, homes sold for 77% of the current estimated value and, in Baltimore, which took the 2nd place spot, homes sold for 78% of value. Number one on the list of top sellers markets was Alameda, California and San Francisco, California tied for the top spot with homes selling for 108% of the estimated value. Cities in California occupied six of the 10 slots on the top 10 seller’s market list.
St Louis’ Top Sellers Markets and Top Buyers Markets…
(We work hard on this and sure would appreciate a “Like”)[iframe http://www.facebook.com/plugins/like.php?href=https%3A%2F%2Fwww.facebook.com%2FStLouisRealEstateNews&send=false&layout=standard&width=50&show_faces=false&font&colorscheme=light&action=like&height=35&appId=537283152977556 100 35 ]
Search St Louis Homes For Sale HERE
See ALL Homes That Will Be Open In St Louis This Weekend Continue reading “City of St Louis Makes Top Spot on National List of Top Buyer’s Markets“
By Dennis Norman, on May 21st, 2015 St Louis foreclosures increased in April from the month before in the St Louis area counties of St Charles, Jefferson and Franklin, were fairly level in St Louis County and declined almost 12 percent in the city of St Louis. For the 5 counties that make up the core of the St Louis real estate market, the median increase in foreclosure activity in April 2015 from the month before was, as the table below shows, 10.68%, and, compared with foreclosure activity from April 2014, the median increase in foreclosure activity was almost 30 percent, according to data released this morning by RealtyTrac.
However, it is not uncommon to have monthly spikes or dips, so it is better to look at a 12 month rolling average to see what the overall trend is. As the table shows, when we look at the 12 month rolling average for St Louis foreclosure activity, we see that there was only a slight increase in April 2015 from the month before and nearly a 40 percent decline from a year ago. It’s only been recently that RealtyTrac began publishing the rolling 12 month data but I think it has really helped see what the real trends are with regard to foreclosures.
(We work hard on this and sure would appreciate a “Like”)[iframe http://www.facebook.com/plugins/like.php?href=https%3A%2F%2Fwww.facebook.com%2FStLouisRealEstateNews&send=false&layout=standard&width=50&show_faces=false&font&colorscheme=light&action=like&height=35&appId=537283152977556 100 35 ]
Search St Louis Foreclosures For Sale HERE
Search St Louis Homes For Sale HERE
By Dennis Norman, on May 13th, 2015 A definite confirmation of an improving real estate market is the fact that, according to a report just released by RealtyTrac, loan originations, for the purchase of a home, during the first quarter of 2015 increased 17 percent from a year ago. Additionally, Kansas City, Missouri saw the 4th largest increase from a year ago, of major metro areas, with a 32 percent increase in home loans. St Louis made the top 20 list for year or year increases with a 13 percent increase.
(We work hard on this and sure would appreciate a “Like”)[iframe http://www.facebook.com/plugins/like.php?href=https%3A%2F%2Fwww.facebook.com%2FStLouisRealEstateNews&send=false&layout=standard&width=50&show_faces=false&font&colorscheme=light&action=like&height=35&appId=537283152977556 100 35 ]
Search St Louis Homes For Sale HERE
See ALL Homes That Will Be Open In St Louis This Weekend
By Dennis Norman, on May 7th, 2015 Flipping homes accounts for a smaller percentage of home sales today at about 4 percent of total home sales in the U.S., then in the recent past when they accounted for 6 percent of more of the homes being sold (6.8% at the recent peak in 1st quarter 2012), according to a report released today by RealtyTrac.
According to RealtyTrac, Baltimore Maryland is the best place to flip homes based upon the gross profit margin calculated as a return on investment (ROI) coming with a 94.1% ROI! Before you get too excited, don’t think that is what the investor walked away with, the gross margin is just based upon the difference between the purchase price and sale price and does not take into account any expenses for remodeling, resale, etc. As the table below shows, the next 4 out of 5 cities at the top of the list can all be found in Florida.
Memphis Tennessee is the metro area with the highest percentage of flips with home flipping accounting for over 10 percent (10.6%) of all the home sales. The table at the bottom lists the 20 markets with the highest percentage of flipping.
(We work hard on this and sure would appreciate a “Like”)[iframe http://www.facebook.com/plugins/like.php?href=https%3A%2F%2Fwww.facebook.com%2FStLouisRealEstateNews&send=false&layout=standard&width=50&show_faces=false&font&colorscheme=light&action=like&height=35&appId=537283152977556 100 35 ]
Search St Louis Homes For Sale HERE
See ALL Homes That Will Be Open In St Louis This Weekend
Want to flip property? Check out my video on how to buy foreclosures here. Continue reading “Baltimore Tops List Of Metros For Highest Returns From Flipping Homes“
By Dennis Norman, on May 6th, 2015 House flipping in St Louis accounted for just 2.4 percent of the home sales in the St Louis metro area during the first quarter of this year, according to data just obtained from RealtyTrac. This is a decline a 69 percent from a year ago when “flips” accounted for 7.7 percent of all St Louis home sales.
Highlights from the 1st Quarter 2015 report:
- There were 115 house flips during the 1st quarter of 2015
- This was a 57% decline from the prior quarter and a 69% decline from the 1st quarter of 2014
- Average days to flip a home during the quarter was 169
- Average purchase price was $79,398, average sale price $101,495
- Average gross margin on flips during the quarter was 22%
- Average gross return on investment during the quarter was 27.8% which is down from 47.9% a year ago
(We work hard on this and sure would appreciate a “Like”)[iframe http://www.facebook.com/plugins/like.php?href=https%3A%2F%2Fwww.facebook.com%2FStLouisRealEstateNews&send=false&layout=standard&width=50&show_faces=false&font&colorscheme=light&action=like&height=35&appId=537283152977556 100 35 ]
Search St Louis Homes For Sale HERE
See ALL Homes That Will Be Open In St Louis This Weekend
Want to flip property? Check out my video on how to buy foreclosures here.
By Dennis Norman, on April 17th, 2015 Foreclosure activity in St Louis was on the rise in March with the foreclosure rate for the St Louis metro area increasing 14 percent from a year ago and over 64 percent from February, according to the latest data from RealtyTrac. As the chart below shows, foreclosure activity for the larger Missouri counties that are included in the St Louis MSA saw foreclosure actions decline from a year ago with the exception of Franklin County which saw a big increase.
(We work hard on this and sure would appreciate a “Like”)[iframe http://www.facebook.com/plugins/like.php?href=https%3A%2F%2Fwww.facebook.com%2FStLouisRealEstateNews&send=false&layout=standard&width=50&show_faces=false&font&colorscheme=light&action=like&height=35&appId=537283152977556 100 35 ]
Search St Louis Foreclosures For Sale HERE
Search St Louis Homes For Sale HERE
Continue reading “St Louis Foreclosures Rise In March“
By Dennis Norman, on April 1st, 2015 Seriously underwater homeowners, those people whose mortgage debt is 125 percent or more of their current home’s value, increased to 13.2% of all home loans during the 1st quarter of 2015, marking the first increase in rate from the prior quarter since February 2012, according to a report released this morning from RealtyTrac. As the chart below shows, the percentage of homeowners that are seriously underwater, peaked during the 2nd quarter of 2012 at 28.6% and has decreased every quarter until reaching the most recent low of 12.7% during the 4th quarter of last year.
(We work hard on this and sure would appreciate a “Like”)[iframe http://www.facebook.com/plugins/like.php?href=https%3A%2F%2Fwww.facebook.com%2FStLouisRealEstateNews&send=false&layout=standard&width=50&show_faces=false&font&colorscheme=light&action=like&height=35&appId=537283152977556 100 35 ]
Search St Louis Homes For Sale HERE
See ALL Homes That Will Be Open In St Louis This Weekend Continue reading “Percentage of Underwater Homeowners Increases For First Time In Nearly Three Years“
By Dennis Norman, on March 27th, 2015 RealtyTrac published a report earlier this week revealing median home prices in the U.S. increased over the past two years at a rate 13 times greater than what wages increased during the same period. RealtyTrac’s report included a chart (below) showing several metropolitan areas throughout the U.S. where, over a recent two year period, home prices were outpacing wages and that “either wages are going to need to go up or (home) prices are going to need to at least flatten out and wait for wages to catch up.”
St Louis Home Price Appreciation Versus St Louis Wage Growth:
As I often remind everyone, all real estate is local, so I wanted to look at local data to see how St Louis shaped up in an analysis similar to the one done by RealtyTrac. I was particularly interested in the outcome of my analysis since it wasn’t that long ago I wrote an article questioning whether home prices in St Louis were too low and now, on a national level, the discussion seems to be perhaps they are too high.
(We work hard on this and sure would appreciate a “Like”)[iframe http://www.facebook.com/plugins/like.php?href=https%3A%2F%2Fwww.facebook.com%2FStLouisRealEstateNews&send=false&layout=standard&width=50&show_faces=false&font&colorscheme=light&action=like&height=35&appId=537283152977556 100 35 ]
Continue reading “Are Home Prices Rising Faster Than Income, Again?“
By Dennis Norman, on March 19th, 2015 St Louis foreclosures declined in February for the St Louis MSA with a total of 843 foreclosure actions occurring during the month, a decline of over 22 percent from the month before and a decline of over 10 percent from a year ago, according to data just released this morning by RealtyTrac.
As the table below shows, foreclosure activity decreased in all of the counties in the core St Louis market during February from the month before and all, except Franklin County, saw a decrease from a year ago.
On a national level, RealtyTrac reported 101,938 foreclosure actions occurred during the month of February in the U.S., a decline of 4% from January, a decline of 9% from February 2014, and the lowest level since July 2006.
(We work hard on this and sure would appreciate a “Like”)[iframe http://www.facebook.com/plugins/like.php?href=https%3A%2F%2Fwww.facebook.com%2FStLouisRealEstateNews&send=false&layout=standard&width=50&show_faces=false&font&colorscheme=light&action=like&height=35&appId=537283152977556 100 35 ]
Search St Louis Foreclosures For Sale HERE
Search St Louis Homes For Sale HERE
Continue reading “St Louis Foreclosures Decline In February“
By Dennis Norman, on February 27th, 2015
Two zip codes in the city of St Louis made RealtyTrac’s list of “Zips with the highest gross returns (from flipping property)” for 4th quarter, 2014. The 63139 zip code, which includes the Dog Town area of St Louis, came in number 2 on the list with an average gross return on investment of 163.9% and the 63116 zip code, which includes Tower Grove South, Holly Hills, Dutchtown South and Bevo, came in 9th on the list with an average gross return on investment of 127.7%.
To be eligible to be considered for the list, there had to be at least 10 single family homes “flips” completed during the 4th quarter of 2014. In the 63139 area of St Louis, there were 18 such home flips during the quarter with an average purchase price of $9,000 and an average gross profit of $14,750 from the flip. In the 63116 zip area, there were 21 flips during the quarter with an average purchase price of $27,721 and an average gross profit of $35,407. The table below shows the data for all 10 top gross returns from flipping property zips in the U.S.
(We work hard on this and sure would appreciate a “Like”)[iframe http://www.facebook.com/plugins/like.php?href=https%3A%2F%2Fwww.facebook.com%2FStLouisRealEstateNews&send=false&layout=standard&width=50&show_faces=false&font&colorscheme=light&action=like&height=35&appId=537283152977556 100 35 ]
Search St Louis Homes For Sale HERE
See ALL Homes That Will Be Open In St Louis This Weekend
Want to flip property? Check out my video on how to buy foreclosures here.
Continue reading “Two St Louis Areas were the most profitable zips in the U.S. for flipping property in 4th quarter“
By Dennis Norman, on February 20th, 2015 Institutional investors (entities that bought at least 10 residential properties in the last 12 months) are having much less of an impact on the housing market throughout Missouri than they were a year ago, according to a newly released report by RealtyTrac. According to the report, during the 4th quarter of 2014 three percent (3%) of all residential sales in Missouri were to institutional investors, a decline of 50% from the 4th quarter of 2013 when institutional investors accounted for 6% of all residential sales in Missouri.
Cash home sales in Missouri has fallen by almost half as well, with cash sales during the 4th quarter in Missouri accounting for 10.3% of all residential sales, down nearly 50% from the 4th quarter of 2013 when a whopping 20.1% of all residential sales in Missouri were to cash buyers. This is not surprising as a lot of investors (both institutional as well as individual) are cash buyers so as the number of distressed home sales continues to fall, so does the presence of investors in the market ergo there go the cash sales too.
(We work hard on this and sure would appreciate a “Like”)[iframe http://www.facebook.com/plugins/like.php?href=https%3A%2F%2Fwww.facebook.com%2FStLouisRealEstateNews&send=false&layout=standard&width=50&show_faces=false&font&colorscheme=light&action=like&height=35&appId=537283152977556 100 35 ]
By Dennis Norman, on February 12th, 2015 St Louis foreclosures increased dramatically in January with 1,116 foreclosure actions in the St Louis metro area during the month, an increase of 52.25 percent from December and an increase of 47.42 percent from January 2014, according to data just released this morning by RealtyTrac.
As the table below shows, all of the counties in the core St Louis market saw an increase in foreclosure activity during January from the month before and all, except Jefferson County, saw an increase from a year ago.
On a national level, RealtyTrac is reporting that foreclosure activity in January increased 5 percent from December but declined 4 percent from January 2014.
(We work hard on this and sure would appreciate a “Like”)[iframe http://www.facebook.com/plugins/like.php?href=https%3A%2F%2Fwww.facebook.com%2FStLouisRealEstateNews&send=false&layout=standard&width=50&show_faces=false&font&colorscheme=light&action=like&height=35&appId=537283152977556 100 35 ]
Search St Louis Foreclosures For Sale HERE
Search St Louis Homes For Sale HERE
Continue reading “St Louis Foreclosures Increase In January Nearly 50 Percent From Year Before“
By Dennis Norman, on February 6th, 2015 Over half (51%) of the foreclosures in St Louis are “Zombies” meaning that the owners have abandoned or vacated their home prior to their lender completing the foreclosure process, according to a report released this morning by RealtyTrac. Just like the number of St Louis foreclosures is down significantly from a year ago, the actual number of Zombie foreclosures has declined 59% from a year ago.
The chart below shows zombie foreclosure data for the 10 metro areas in the U.S. with the highest percentage of Zombie foreclosures. Beneath that is a table showing the 10 metro in the U.S. with the most number of Zombie foreclosures which shows New York leads the nation with over 19,000 zombie foreclosures as well as a chart showing the States with the highest number of Zombies.
(We work hard on this and sure would appreciate a “Like”)[iframe http://www.facebook.com/plugins/like.php?href=https%3A%2F%2Fwww.facebook.com%2FStLouisRealEstateNews&send=false&layout=standard&width=50&show_faces=false&font&colorscheme=light&action=like&height=35&appId=537283152977556 100 35 ]
Search St Louis Foreclosures For Sale
Search St Louis Homes For Sale HERE
Continue reading “Over Half Of St Louis Foreclosures Are Zombies – Highest Rate in Nation“
By Dennis Norman, on February 4th, 2015 Down payment help is available for 87 percent of the homes in the U.S., according to an analysis completed recently by RealtyTrac and Down Payment Resource. This analysis looked at the geographic location of homes to see if they were within areas where down payment assistance are available to purchasers meeting the qualifications of the program.
In the St Louis area, there are several down payment help, or down payment assistance programs, available, most of which are administered by the Missouri Housing Development Commission (MHDC). These programs include:
- Cash Assistance Loan Program (CAL)
- Qualified first-time homebuyers may receive a second mortgage equal to 3% of their mortgage amount which can be used for down payment or closing costs.
- The loan is a five-year loan at 0 percent interest with no monthly payments required. The loan will be forgiven after the buyer has occupied the home for 5 years.
- Non-Cash Assistance Loan Program (NON-CAL)
- Qualified first-time homebuyers that do not need down payment assistance can obtain a lower interest rate home loan than those that use the CAL program above.
- Because of the lower interest rates, borrower will have a lower monthly payment.
The best down payment assistance program in St Louis though is the BMO Harris Bank Affordable Housing Grant Program. This program is available to all qualified home buyers (not just first-tome buyers) and, instead of being a loan that may be forgiven after living in the home for a period of time, it is a no-strings attached grant that can be used for down payment or closing costs. Grants of up to $3,000 are available to home buyers that purchase homes in specified neighborhoods throughout St Louis. Click HERE to find out more about this great down payment help program!
By Dennis Norman, on February 2nd, 2015 The city of St Louis made the list of the top 50 markets to rent to Millenials, published by RealtyTrac. In determining the best markets in the U.S. for renting to millennial (most of whom are in their 20’s or early 30’s), RealtyTrac looked at rental markets where the gross annual yield on rentals was at least 9 percent, where Millenials make up more than 22 percent of the market (the national average) and where the Millenial population had increased at least 5% from 2007 through 2013.
For the city of St Louis, as the table below shows, the Millenial population grew 18% from 2007 to 2013 and in 2013 accounted for over 28% of the market.
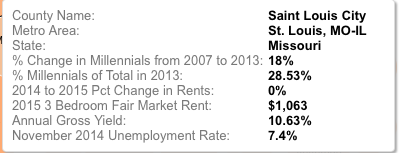 Source: RealtyTrac Continue reading “St Louis Ranked As One Of Top 50 Markets To Rent To Millenials“
By Dennis Norman, on January 22nd, 2015 There were 119,936 St Louis homeowners with negative equity, or in a seriously underwater condition on their mortgage meaning they owe more than the current value of their home, in the St Louis MSA during the 4th quarter of 2014 which is a 21% improvement from the prior quarter when there were 152,025 St Louis homeowners seriously underwater, according to a report just released today by RealtyTrac.
As the table below shows, for the immediate St Louis, MO area, the city and county of St Louis had the highest percentage of underwater homeowners at 22% and St Charles county had the lowest percentage at 6%.
(We work hard on this and sure would appreciate a “Like”)[iframe http://www.facebook.com/plugins/like.php?href=https%3A%2F%2Fwww.facebook.com%2FStLouisRealEstateNews&send=false&layout=standard&width=50&show_faces=false&font&colorscheme=light&action=like&height=35&appId=537283152977556 100 35 ]
Find your home’s market value online in LESS THAN A MINUTE!
Search all St Louis Homes For Sale HERE
Search St Louis Short Sales HERE
By Dennis Norman, on January 16th, 2015 Missouri foreclosure filings during 2014 occurred on a total of 9.762 properties in Missouri which is down over 70% from 2010 when foreclosure activity in Missouri hit an all-time record high with foreclosure filings occurring that year on 33,120 properties, according to data just released by RealtyTrac. Below is a complete table showing Missouri foreclosure filings for each year, from the real estate “boom” year of 2006 through 2014, for all counties in Missouri which reveals that in most counties in Missouri foreclosure activity peaked during 2010.
Foreclosure filings in the Missouri counties that make up the St Louis MSA occurred on a total of 5,310 properties during 2014, down 68% from 2010 when foreclosure activity hit a record high in the Missouri counties of the St Louis MSA with foreclosure filings taking place on 16,588 properties that year.
(We work hard on this and sure would appreciate a “Like”)[iframe http://www.facebook.com/plugins/like.php?href=https%3A%2F%2Fwww.facebook.com%2FStLouisRealEstateNews&send=false&layout=standard&width=50&show_faces=false&font&colorscheme=light&action=like&height=35&appId=537283152977556 100 35 ]
Search St Louis Foreclosures For Sale
Continue reading “Missouri Foreclosure Filings For 2014 Down Seventy Percent From Peak in 2010“
By Dennis Norman, on December 31st, 2014 St Louis Distressed Home Sales ticked up slightly in November 2014 rom October but declined over thirty percent (30.8%) from November 2013, according to data just released by RealtyTrac. As the table below shows, all the counties in the St Louis core market except one saw an increase in distressed home sales in November from the month before and all saw a decline in November from a year ago.
On a national level, distressed home sales in November 2014 accounted for 12.6% of all home sales, down from 13.7% in October and from 14.8% in November 2013.
(We work hard on this and sure would appreciate a “Like”)[iframe http://www.facebook.com/plugins/like.php?href=https%3A%2F%2Fwww.facebook.com%2FStLouisRealEstateNews&send=false&layout=standard&width=50&show_faces=false&font&colorscheme=light&action=like&height=35&appId=537283152977556 100 35 ]
 Copyright 2014 – St Louis Real Estate News – Data Source: RealtyTrac
By Dennis Norman, on December 11th, 2014 St Louis foreclosure activity continued to decline in November with the number of foreclosure actions decreasing in all of the St Louis core counties from the month before, according to a report just released this morning from RealtyTrac. The St Louis MSA as well as the core counties that make up the bulk of the St Louis market in Missouri, also saw double digit declines in foreclosure activity in November from the year before with the exception being Jefferson County which, as the table below shows, saw an increase of almost 90%.
(We work hard on this and sure would appreciate a “Like”)[iframe http://www.facebook.com/plugins/like.php?href=https%3A%2F%2Fwww.facebook.com%2FStLouisRealEstateNews&send=false&layout=standard&width=50&show_faces=false&font&colorscheme=light&action=like&height=35&appId=537283152977556 100 35 ]
Search St Louis Foreclosures For Sale
Continue reading “St Louis Foreclosure Activity Continues Downward Trend“
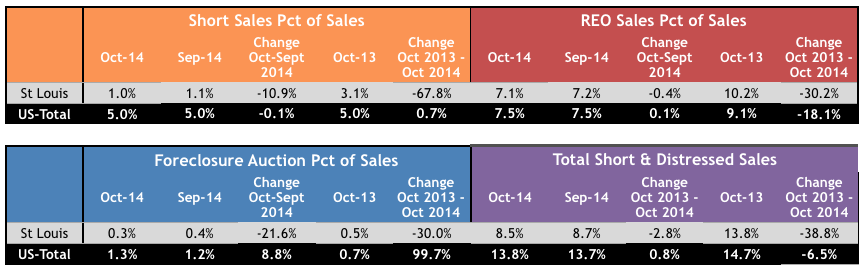
By Dennis Norman, on November 28th, 2014 St Louis Distressed Home Sales continue to have less impact on the St Louis real estate market paving the way for sustainable home appreciation, according to the latest data available from RealtyTrac. According to the chart below, short sales in St Louis accounted for just 1% of the overall home sales last month, a 10% decrease from the month before and a decrease of almost 68% from a year ago. Nationally, short sales accounted for 5% of all home sales last month.
St Louis REO’s (bank-owned properties obtained through foreclosure) declined slightly in October from the month before and dropped over 30% from a year ago.
(We work hard on this and sure would appreciate a “Like”)[iframe http://www.facebook.com/plugins/like.php?href=https%3A%2F%2Fwww.facebook.com%2FStLouisRealEstateNews&send=false&layout=standard&width=50&show_faces=false&font&colorscheme=light&action=like&height=35&appId=537283152977556 100 35 ]
By Dennis Norman, on November 21st, 2014 Property “flips” in St Louis slowed during the 3rd quarter of this year to just 234 properties flipped in the St Louis MSA during the quarter making up 2.6% of overall home sales for the quarter, a decline of 20% from the quarter before and a decline of 55% from the third quarter of 2013, according to data just released by RealtyTrac. Property flipping is a term that has been loosely applied to a variety of real estate transactions but, for the purpose of this report, was considered to be when a single family home sold in during the third quarter had been sold within the previous 12 months.
Back in 1979, when I entered the real estate business, my focus was on buying property to resell and a “flip” at that time referred to a property I had under contract to buy that I managed to sell, or “flip” to someone else (often a competitor) with the closing of both my purchase and my sale taking place on the same day, hence a “flip”. So, in the last 35 years a flip has went from being a property bought and sold on the same day to one bought and sold within a year…hmm…
Find St Louis Property to Flip

(We work hard on this and sure would appreciate a “Like”)[iframe http://www.facebook.com/plugins/like.php?href=https%3A%2F%2Fwww.facebook.com%2FStLouisRealEstateNews&send=false&layout=standard&width=50&show_faces=false&font&colorscheme=light&action=like&height=35&appId=537283152977556 100 35 ]
By Dennis Norman, on November 14th, 2014 St Louis Foreclosure Activity was on the rise during the month of October with a big spike in foreclosure activity from the month before in St Charles and Franklin Counties as well as the St Louis MSA as a whole, according to newly released data from RealtyTrac. As the table below shows, St Charles County saw an increase of over 3,000% in foreclosure activity during the month of October from September, and over a 400% increase in activity from October 2013, however, this is the result of a large influx of REO property in October. When you look at the second table below, showing year-to-date foreclosure activity, you will see that St Charles County foreclosure activity is actually down 13.6% in 2014 from the same time period in 2013.
(We work hard on this and sure would appreciate a “Like”)[iframe http://www.facebook.com/plugins/like.php?href=https%3A%2F%2Fwww.facebook.com%2FStLouisRealEstateNews&send=false&layout=standard&width=50&show_faces=false&font&colorscheme=light&action=like&height=35&appId=537283152977556 100 35 ]
Search St Louis Foreclosures For Sale
Continue reading “St Louis Foreclosure Activity Increases In October But Down Overall“
By Dennis Norman, on November 6th, 2014 Cash home sales’ percentage of overall home sales declined during the 3rd quarter of this year from the 2nd quarter in the city of St Louis as well as St Louis and St Charles County, according to data just released by RealtyTrac. As the table below shows, the counties of Jefferson and Franklin saw cash sales take a bigger share of their home sales during the same period.
Purchases of homes by institutional investors increased during the 3rd quarter from the quarter before in Franklin and Jefferson County as well as the City of St Louis and declined in St Charles and St Louis county.
(We work hard on this and sure would appreciate a “Like”)[iframe http://www.facebook.com/plugins/like.php?href=https%3A%2F%2Fwww.facebook.com%2FStLouisRealEstateNews&send=false&layout=standard&width=50&show_faces=false&font&colorscheme=light&action=like&height=35&appId=537283152977556 100 35 ]
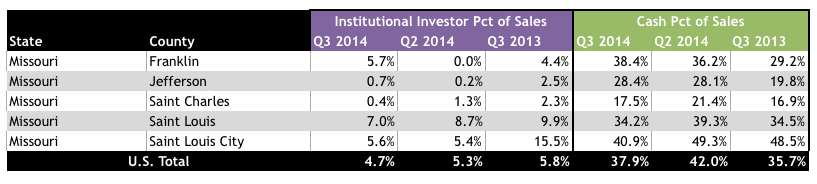 Source: RealtyTrac
By Dennis Norman, on October 29th, 2014 Halloween may be just two days away however zombies are getting harder to find in St Louis, or at least “foreclosure zombies“. That’s right, according to the latest data from RealtyTrac, during the 3rd quarter of this year St Louis had 481 zombie foreclosures (homes in the foreclosure process, not yet foreclosed upon and the owner has vacated) or about 33 percent of the St Louis foreclosures. This is down 40 percent from the quarter before and down 70 percent from a year ago.
This is good news as zombie foreclosures quickly become a nuisance as well as an eyesore for the neighborhood as the owner has left and is no longer maintaining the property however, the lender has not yet foreclosed and therefore is typically not maintaining the property either. The zombie ends up kind of in “no man’s land” until the foreclosure is finally complete and the lender’s asset manager takes control.
(We work hard on this and sure would appreciate a “Like”)[iframe http://www.facebook.com/plugins/like.php?href=https%3A%2F%2Fwww.facebook.com%2FStLouisRealEstateNews&send=false&layout=standard&width=50&show_faces=false&font&colorscheme=light&action=like&height=35&appId=537283152977556 100 35 ]
Search St Louis Foreclosures For Sale Continue reading “Zombies Are Becoming Scarce In St Louis“
By Dennis Norman, on October 28th, 2014 Distressed home sales in St Louis accounted for 7.97 percent of all home sales during the 3rd quarter, down from 9.84 percent the quarter before and down a whopping 40 percent from a year ago when distressed sales accounted for 13.6 percent of all homes sold in the St Louis MSA, according to the latest data from RealtyTrac. State-wide for Missouri, distressed home sales made up 7.12 percent of home sales during 3rd quarter, lower than the rate for St Louis however, at the other side of our state, in Kansas City, distressed home sales share of home sales was 9.2% for 3rd quarter, about 15% higher than St Louis. The table below shows the breakdown of distressed sales by short sales, REO’s and foreclosure auction.
(We work hard on this and sure would appreciate a “Like”)[iframe http://www.facebook.com/plugins/like.php?href=https%3A%2F%2Fwww.facebook.com%2FStLouisRealEstateNews&send=false&layout=standard&width=50&show_faces=false&font&colorscheme=light&action=like&height=35&appId=537283152977556 100 35 ]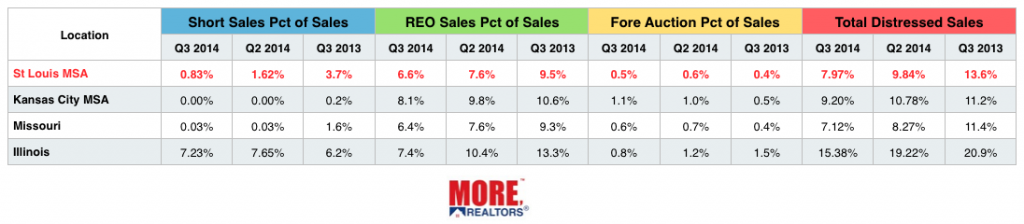
By Dennis Norman, on October 23rd, 2014 Over half of the homeowners in Ferguson are in a negative-equity position meaning their current mortgage loan balance exceeds the current value of their home, according to data from RealtyTrac. According to the latest data available, 51% of the homeowners in Ferguson with a mortgage are seriously underwater on their mortgages with balances that are equal to or higher than 125% of the value of their homes. Another 14% of Ferguson homeowners have mortgage balances of between 90% and 110% of the value of their homes.
Ferguson Serious Underwater Rate More Than Double Rate for St Louis MSA…
As the table below shows, Ferguson’s seriously underwater rate, at 51%, is more than double the rate for the St Louis MSA as a whole (21%) and is nearly double the rate for St Louis county of 27%. At the other end of the spectrum, only 6% of Ferguson homeowners have mortgages equal to 50%, or less, of the value of their homes, exactly half the rate for St Louis County and less than half the rate for the St Louis MSA.
(We work hard on this and sure would appreciate a “Like”)[iframe http://www.facebook.com/plugins/like.php?href=https%3A%2F%2Fwww.facebook.com%2FStLouisRealEstateNews&send=false&layout=standard&width=50&show_faces=false&font&colorscheme=light&action=like&height=35&appId=537283152977556 100 35 ] Continue reading “Over Half Of Ferguson Homeowners Have Negative Equity“
|
Recent Articles
|