The St. Louis housing market is undergoing some noteworthy changes, according to the latest data from MORE, REALTORS®. As of today, the supply of homes for sale in St. Louis stands at 1.43 months, a slight uptick from the 1.38-month supply reported at the end of September and the highest level in over 3 years. Additionally, the median price has settled at $260,000, and nearly half (48%) of the active listings have reduced their asking price from their original figures.
A Closer Look at Pricing Trends
Two additional reports from MORE, REALTORS® offer a nuanced view of the market’s pricing dynamics:
October 2, 2023 Report: Homes sold during the 30-day period ending on October 2nd had a median price of $285,000 or $191 per square foot.
October 27, 2023 Report: Homes sold from October 3rd through October 27th had a median price of $270,000 or $185 per square foot.
These reports indicate a slight softening in home prices, which could be attributed to various factors, including seasonality.
Seasonal Impact on the Market
As we transition from fall into winter, it’s essential to acknowledge the seasonal effects on home sales and prices. Historically, the colder months tend to see a slowdown in market activity, which could explain the recent changes in pricing and supply.
The St. Louis real estate market is a complex landscape, influenced by various factors such as location, amenities, and notably, school districts. In this article, we delve into an exclusive comparison between two St Louis school districts: Rockwood in west St Louis county and Ferguson-Florissant in north St Louis county. Utilizing the STL Market Reports provided exclusively by MORE, REALTORS®, as well as infographics depicting census data, we aim to offer a comprehensive overview of these markets for the 12-month period ending September 30, 2023.
Key Market Trends
Rockwood School District
Decline in Sales: The Rockwood School District saw a decline of 28.63% in the number of homes sold compared to the prior 12-month period.
Increase in Price: Despite the decline in sales, the median sold price increased by 3.45%.
Ferguson-Florissant School District
Decline in Sales: The Ferguson-Florissant School District experienced a decline in sales of 18.42%.
Decrease in Price: Unlike Rockwood, Ferguson-Florissant also saw a decline in the median sold price by 1.99%.
As a follow-up to my previous article on the diverging trends in luxury and non-luxury home sales in the St. Louis area, we now turn our attention to the current state of inventory in these two segments. The tables below (exclusively available from MORE, REALTORS®) reveals a surprising contrast: the supply of luxury homes (with a list price of $700,000 or above) in the St. Louis 5-County Core market stands at 2.13 months, while the inventory for non-luxury homes is only 1.40 months.
A Closer Look at Luxury Home Inventory
The 2.13-month supply of luxury homes in the St. Louis 5-County Core market suggests, while still favoring sellers, a more balanced market than the non-inventory market which, due to the very low supply, still favors sellers.
The St. Louis real estate market is experiencing a fascinating divergence in trends between luxury and non-luxury homes. According to the latest data from MORE, REALTORS®, the market for luxury homes—those priced at $750,000 and above—is on the rise, reaching its highest level in eight months. In contrast, the market for non-luxury homes, priced below $750,000, has been on a steady decline for about two years. This article delves into these trends, referencing two illuminating charts from MORE, REALTORS®.
Luxury Home Sales on the Upswing
The first chart from MORE, REALTORS® illustrates the upward trajectory of luxury home sales in the St. Louis area. As the chart shows, for the 12-month period ended September 30, 2023, there were 1,351 luxury homes sold in the combined markets of the city and counties of St Louis and St Charles County, which is the highest 12-month trend since January of this year.
According to the latest MLS data reported by MORE, REALTORS®, there is currently a 1.38-month supply of homes for sale in the 5-county core market of St. Louis. While this may not seem like a significant inventory, it’s worth noting that for the past few years, the supply was below half a month. It gradually increased to over one month and reached 1.38 months at the end of September. This represents the highest level of inventory, based on months’ supply, that the St. Louis area has seen in over three years. However, this is still well below the historical norm of a 4 to 6-month supply.
Home sales for 12-month period ended September 3oth were, as the report below shows, down nearly 20% in the St Louis area and home prices were up 3.77%.
As a result of rising interest rates and home prices at levels higher than increases in income, homes in St Louis continue to become less affordable. In fact, according to data just released by ATTOM Data Research, home affordability declined double digits during the 3rd quarter of this year in all five counties that make up the St Louis core market. As the info graphic below illustrates, the percentage of wages needed to buy a home have, depending upon county, increased about a third to almost half from the historical “norm”.
Least affordable ever…
Three of the five counties that make up the St Louis Core market (St Louis, St Louis City, and St Charles) hit the least affordable levels ever during 3rd quarter, with Franklin County hitting its lowest level last quarter and seeing a slight uptick in affordability during 3rd quarter. Conversely, Jefferson County saw its least affordable quarter back in 2007.
Most affordable ever…
We have to take a quick stroll down memory lane to visit when homes were most affordable in the St Louis area. Franklin County had its most affordable quarter just back in 2020, St Louis County was back in 2013, Jefferson and St Charles 2012 and the City of St Louis had its most affordable quarter over 14 years ago in 2009.
St Louis Home Affordability – 3rd Quarter 2023
(click on image below for full infographic showing all info)
There were 788 homes and condominiums “flipped” during the second quarter of this year in the St Louis M.S.A., according to data just released by ATTOM Data Solutions. As the infographic below illustrates, these flips represent 8.7% of all sales during the quarter, a decrease of 23.9% from the prior quarter and a decline of over 22% from a year ago.
St Louis Home Flipping Report Q2 2023
(click on infographic to see complete report including prices and profits)
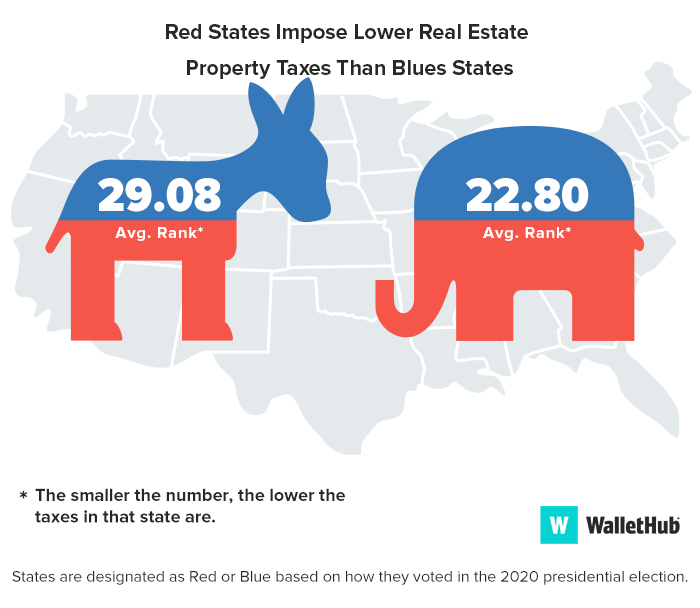
According to a study released earlier this year by WalletHub, Missouri property tax rates are the 29th lowest in the U.S. To determine the tax rates for this list, WalletHub took the median property tax payment for each state and divided it by the median property value to determine the effective tax rate. For Missouri, the median home price was $171,800 and median property tax was $1,676 resulting in an effective tax rate of 0.98%. Hawaii was the state with the lowest tax rate coming in at a scant 0.29% and New Jersey the highest at 2.47%.
WalletHub also compared “Blue States” with “Red States” and, as the infographic at the bottom shows, found that Red States impose lower real estate property taxes than Blue States.
Below is the St Louis Real Estate Market Report for June 2023 for the City and County of St Louis combined from St Louis Real Estate Search (the Official site). You can access the full infographic, containing data for St Charles, Jefferson and Franklin Counties as well by clicking on the image below.
In the relentless tug-of-war that characterizes today’s real estate market, it’s imperative not to base your choices on misguided data!
The present property market leaves little room for errors, thanks to a deficit of listings and aggressive buyer interest. A combination of these factors has sparked not just bidding contests, but “conditions wars”, making the process exceedingly tough for many. To outshine the competition, buyers often eliminate contingencies from their bids and stretch their financial limits. Frequently, they’re ready to pay a premium beyond the property’s actual worth. As I elaborated in an earlier article, “Are Today’s Homebuyers Exorbitantly Overpaying and Setting Themselves Up for Regret?“, this strategy can be valid, as long as it’s backed by well-informed reasoning.
In order to make such informed decisions, one needs reliable data and a seasoned, professional real estate agent capable of dissecting that data and tailoring it to your specific circumstances. This is what makes me incredibly proud of our team at MORE, REALTORS®. Our representatives are experienced professionals adept at steering both buyers and sellers towards a rewarding outcome amidst the complex dynamics of the current market.
To assist our representatives and clientele, I devote substantial time to accumulating, examining, and disseminating market intelligence and data. My goal is to offer the most exact data possible, enabling shrewd, educated decision-making. Although no data set can claim absolute precision, inching as close to perfection as we can substantially boosts the probability of making prudent decisions.
Doesn’t every agent have the same data at their disposal?
It’s a reasonable assumption that all agents, particularly those affiliated with REALTORS®, can access the same information. In our region, every REALTOR® can indeed tap into the broadest and most detailed reservoir of data for the St. Louis residential real estate market — MARIS, the REALTOR® Multiple Listing System (MLS). However, merely gaining entry to this database is just the initial step. It’s similar to the internet: although nearly any data you desire is available online, the real test is in knowing where to look and identifying the most credible sources. This same notion applies to the property market data present in the MLS.
While most agents aren’t data enthusiasts and usually rely on consolidated data shared by others, our agents, to some degree, follow a similar pattern. Yet, they stand out due to their proficiency in setting parameters and producing bespoke reports for their clients using our exclusive software. Additionally, they don’t merely accept the data we deliver — they scrutinize it, cross-check it, and pinpoint any discrepancies they come across. This degree of dedication, though humbling, reflects their commitment to precision, even when dealing with data from a dependable source like our firm..
For the 12-month period ended June 20, 2023, there were 23,074 homes sold in the St Louis 5-county core market which, as the STL Market Report below (available exclusively from MORE, REALTORS®) shows, is nearly a 20% decline in home sales from the the prior 12-month period when there were nearly 29,000 homes sold. The median price of homes sold during the most recent 12-month period was $270,000, an increase of 5.47% from the prior 12-month period.
St Louis home sales trend continues to fall….
Below the market report is a STL Market Chart showing (also available exclusively from MORE, REALTORS®) the 12-month home sales and home price trend for the St Louis 5-County core market for the past 10 years. The green line on the chart depicts the 12-month sales trend for each month for the past 10-years revealing a decline in the St Louis home sales trend for the past 12-months. The 12-month home sales trend in St Louis is now at the lowest levelsince February 2015.
St Louis home price trend falling as well….
The red line on the chart depicts the median price per square foot St Louis homes sold at for the 12-month period ending in the month shown. Home prices are seasonal and fluctuate every year, through good markets and bad markets, peaking in early summer and hitting a low in during winter. St Louis home prices peaked in June at $192 per square foot, an increase of just 1.6% from June of last year. In comparison, the price increase from June 2022 to June 2023 was 11.2%.
Below is the St Louis Real Estate Market Report for May 2023 for the City and County of St Louis combined from St Louis Real Estate Search (the Official site). You can access the full infographic, containing data for St Charles, Jefferson and Franklin Counties as well by clicking on the image below.
In this competitive market don’t make decisions based upon bad data!
Today’s real estate market is unforgiving for homebuyers, driven by a scarcity of inventory and robust buyer demand. This, coupled with not just bidding wars but “terms wars”, has made it challenging for many. In an effort to stand out, homebuyers are waiving contingencies from their offers and pushing their budgets to the limit. Quite often, these buyers are willing to pay more than the actual worth of the property. As I previously addressed in my article, “Are Homebuyers Today Grossly Overpaying for Homes and Making Decisions They’ll Regret?“, this approach is acceptable, provided it’s a well-informed decision.
To make such decisions, you need accurate data and an experienced, professional agent who can interpret that data and apply it to your unique situation. This is why I take immense pride in our team at MORE, REALTORS®. Our agents are skilled professionals who can guide both buyers and sellers through the intricacies of the current market to a successful outcome.
To support our agents and clients, I invest considerable time in gathering, scrutinizing, and reporting on market information and data. I aim to provide the most precise data possible to empower smart, informed decision-making. While it’s true that no data can be 100% accurate in all respects, getting as close to that ideal as possible improves the odds of making sound decisions.
Don’t all agents have the same data?
It’s logical to think that all agents, especially those who are REALTORS®, have access to the same data. Indeed, in our area, all REALTORS® can access the most extensive and comprehensive source of information for the St Louis residential real estate market — MARIS, the REALTOR® Multiple Listing System (MLS). Yet, simply having access to this wealth of information is only the first step. It’s akin to the internet: while you can find nearly any information you seek online, the real challenge lies in knowing where to find it and determining the most accurate sources. The same principle applies to real estate market data available in the MLS.
While most agents aren’t data nerds and often depend on aggregated data provided by others, our agents, to some extent, do the same. However, a notable difference lies in their ability to define criteria and create their own reports for their clients using our proprietary software. Furthermore, they don’t simply accept the data we provide — they scrutinize it, cross-verify it, and highlight any errors they discover. This level of commitment, while humbling, is a testament to their dedication to accuracy, even when the data comes from a trusted source like our company.
Copy and Paste Culture Among Many Agents...
Contrary to the scrutiny that our agents apply to our data, many agents merely copy and paste infographics or reports they receive, without cross-checking the information. Take, for example, the infographic below showing the median sale price of homes in May 2023 for the city and county of St Louis combined as $255,000. Yet, numerous agents are sharing a report that states the median sale price for that market in May was $285,000. That’s nearly 12% higher than the actual figure, a discrepancy I deem significant. If you’re a buyer basing your offer, even partly, on market data, wouldn’t it be better to know the median price is actually $255,000 and not $285,000? Your next question might be, ‘How do you know your data is accurate?’ I’ve discussed this in detail in a previous article, which remains applicable today.”
I’ve been in the real estate business since I was 17, which means it has been 45 years of experiencing various market conditions, including recessions, inflation, 18% mortgage rates, the burst of the housing bubble, and a myriad of other good and bad things. However, I can confidently say that I have never witnessed a real estate market quite like the one we have been experiencing in the past couple of years.
So, what makes the current real estate market so unique?
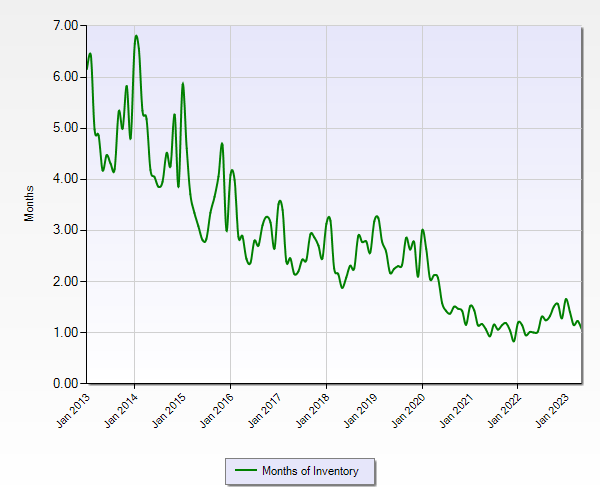
First and foremost, I’ve pondered this question extensively, and I honestly can’t recall a time in this industry when the supply of homes for sale was not at least 4 to 6 months’ worth. Although there was a brief period in 2015 when the inventory of homes in St. Louis fell below 4 months, it quickly returned to nearly 5 months. From 2016 until early 2020, the inventory fluctuated between approximately 2 and 3 months, and then began a downward trend, hitting a record low of less than a 1-month supply in the latter part of 2021. While the supply has slightly increased since then, it still hovers around 1 month.
Months of Inventory – St Louis 5-County Core – 2013 – 2023
This situation showcases the basic law of economics—supply and demand. The supply of homes for sale in St. Louis is exceptionally low, and even though the number of home buyers in the market has seemingly declined significantly over the past few years, there still isn’t enough supply to meet the demand of the remaining buyers. Consequently, in accordance with the law of supply and demand, prices tend to rise when supply is insufficient to meet demand. While it’s easy to increase widget production to meet demand, it’s not as simple to suddenly add thousands of homes to the market in the St. Louis real estate market. Factors such as a lack of available land for development in high-demand areas, lengthy approval processes for new developments, labor shortages in the trades, difficulty in controlling construction costs, and the significant time required to bring a substantial number of homes to the market contribute to this complexity. As a developer, I can attest that the development process is lengthy enough for the market dynamics to change entirely before the first home hits the market.
So, where did all the houses go in St Louis? Why aren’t there more homes for sale?
This might not come as a surprise, given that St. Louis home sales experienced a nearly 20% decline in the past 12 months compared to the previous year, coupled with 30-year fixed-rate loan interest rates approaching 7%. However, mortgage loan originations in St. Louis during the first quarter of this year have reached their lowest level since ATTOM Data began tracking them in the first quarter of 2000. As depicted in the chart below, both home purchase mortgages and total mortgage originations (including purchases and refinances) hit record lows in the first quarter of this year.
During the first quarter, the St. Louis MSA recorded 4,733 mortgage originations, marking a 45% decrease from the previous quarter’s 8,666 originations, and a 54% decrease compared to the same quarter in the previous year when 10,410 mortgages were originated for home purchases
St Louis MSA Mortgage Originations Q1 2000 – Q1 2023 (Chart)
As the infographic below illustrates (which is available exclusively from MORE, REALTORS®) the median price of a home in St Louis (the 5-county core market) has increased 112% since 2000, from $124,900 in 2000 to $265,000 in 2022. During the same time period, the median lease rate, or rental rate, for a St Louis home has increased by just 68%, moving from $955 in 2000 to $1,600 in 2022.
Leasing a home is obviously a better deal, right?
If we set aside the benefits (and responsibilities) of homeownership and the long-term investment aspects, simply looking at the monthly cost might lead us to the conclusion that renting a home in St. Louis could likely save us money compared to buying one. After all, if we just consider the fact that during the aforementioned 22-year period, the cost of buying a St. Louis home increased by nearly 65% more than the cost of leasing one, we would certainly lean towards that conclusion. However, if we account for interest rates, which impact the monthly cost of owning a home (assuming financing is involved), we find that the gap significantly narrows. This is because even though interest rates are higher now than they were just a year or two ago – in fact, roughly double – they are still lower than they were in 2000.
Factoring in interest rates, the gap between buying and leasing narrows significantly.
In 2000, interest rates for a 30-year fixed rate mortgage varied but averaged roughly 7.5%. In contrast, they were around 6% in 2022. As the infographic shows, when we take these rates into account to assess the monthly cost of owning a home, we observe that even though home prices have risen by 112% since 2000, the house payment on a median-priced home has only risen by 82%. While the increase in house payments at 82% is still greater than the 68% increase in leasing, the gap is much smaller. Once other benefits of homeownership are factored in, it becomes easier for many people to justify the additional cost of ownership.
To clarify, I am not claiming that homeownership is for everyone or that leasing is inherently inferior. In fact, I’ve been one of those people who have consistently said that homeownership isn’t for everyone. For many individuals, based on factors like their likelihood of relocating, job and financial stability, money management skills, and others, leasing can be a better alternative. I am simply trying to highlight that the cost gap between the two options may not be as wide as it initially appears.
Below is our St Louis Real Estate Market Report for April 2023 for the City and County of St Louis combined. You can access the full infographic, containing data for St Charles, Jefferson and Franklin Counties as well by clicking on the image below.
What strange and confusing times we live in! Some seemingly credible predictions made by qualified experts suggest that our banking system could collapse, our currency may become worthless, and our country may face a significant downturn. Meanwhile, others claim that there is no cause for alarm. Here in St. Louis, the real estate market continues to thrive as if everything is great in our economy, despite the fact that interest rates have doubled in the past year. I have been in this business for 43 years, and although I have seen many ups and downs in the market, I have never seen anything quite like this before. It appears that there is a stark dichotomy between the economy and the St. Louis real estate market at present, as if they are two entirely separate entities. Could this be the result of the low inventory and high demand for housing, leading homeowners to throw caution to the wind? Or is it possible that the St. Louis economy is stronger than the national economy? Whatever the reason may be, despite talk at the national level of a looming housing market crash, the St. Louis real estate market continues to thrive.
Is the St Louis real estate market going to crash?
Now, onto the question of whether the St. Louis real estate market is going to crash. This is a fair question, given the current issues outlined above. However, so far, there are no clear signs of a crash. That’s not to say that there won’t be any changes to the market, as I believe we’ll see some, but nothing that indicates a crash is imminent at this point. Almost a year ago, I wrote an article in which I stated that “I don’t think St. Louis home prices will come crashing down, in fact, I don’t even think they are going to decline necessarily.” This prediction has proven to be accurate. However, I also said in that same article that “I think the premiums buyers have paid over and above the value of the home they were buying are going to quickly come to an end,” and this has proven to be inaccurate.
Despite my prediction, there are still bidding wars happening between buyers on new listings. The STL Market Chart table below shows that last month, the median price of homes sold was equal to 100% of the current list price at the time of sale. Given that the median is indicative of the midpoint of the frequency of values, if the midpoint is 100%, then it appears that plenty of homes are selling in excess of the list price.
The data for the St. Louis real estate market shows that there is a strong buyer demand. In addition, the market is facing the persistent issue of low inventory. These factors have contributed to the resilience of the St. Louis housing market, making it unlikely to succumb to a crash at this point. However, if there is increased economic uncertainty, inflation, and rising interest rates, we may reach a tipping point and see St. Louis home prices decrease. Despite this possibility, it is unlikely to happen anytime soon based on current data.
A report released today by Redfin reveals that the median U.S. home sale price in March was $400,528 marking a 3.3% decline from March 2022 when the median home price was $414,196. However, the situation in St. Louis is quite different. According to the STL Market Chart (available exclusively from MORE, REALTORS®) below the median price of homes sold in St Louis in March was $260,000, which represents an increase of 4% from March 2022 when the median home price was $250,000.
The chart also depicts the 12-month home sales trend for St. Louis, indicated by the dark green line, which shows a decline since September 2021. During the 12-month period ending on September 30, 2021, there were 30,728 homes sold in the 5-County Core St. Louis market. However, this has fallen monthly, reaching 24,577 for the 12-month period ending last month.
Earlier this week I wrote an article addressing some of the current issues that will likely significantly impact the residential real estate business. IIn the article, I suggested that, as a result of the various challenges to present-day practices, sellers may no longer be required to pay commissions to the buyer’s agent in the near future. Does this mean the role of the buyer’s agent in a transaction is going away and that buyer’s agents are not needed? The short answer is no, buyer’s agents are not going away.
So, buyer agents won’t be impacted by these changes?
Wait, I didn’t say there no impact or effect on buyer’s agents, I said, generally speaking, they are not going away. However, this doesn’t mean that there won’t be real estate agents leaving the profession as a result of not being prepared, able, or willing to deal with the changes. Some agents will leave the profession because, quite frankly, with the change in the way buyer’s agents are compensated, they will find that there are not enough people who see value in paying them to represent them. I know this sounds a little harsh, but I’ll explain what I mean in more detail below.
The bar will be raised…
While my earlier statement sounds a little harsh, I think the reality is that agents that are not committed to this profession, lack the knowledge and skills they should have and don’t deliver the level of representation and service they should to their clients, are going to find it hard to survive in the business in the near future. As transparency increases on how buyer’s agents are compensated, particularly when it becomes known that the compensation is either coming directly from their buyer client or indirectly from them, buyers are likely to be more selective about the agents they choose to work with. Some may argue that buyers may opt to forego having a buyer’s agent and deal directly with the listing agent instead to save some money. I will address that in more detail later, but for the most part, I don’t think that will be the case. Instead, good agents, those who know this business and the market and are true professionals with their clients’ interests at heart, will be rewarded.
For the past several months there have been many reports anticipating the moves of the Federal Reserve regarding interest rates then followed by tons of articles, blog posts and videos analyzing then predicting the impact of the Fed’s decision on the economy. The other popular topic in this area is the “Money Supply”, usually M2 money supply and whether it’s increasing or decreasing as well as the impact on the economy.
Should St Louis homeowners and potential home buyers really care about the Fed Funds rate or M2 money supply?
First, let’s talk about the Fed Funds rate and what it is, what it is intended to do and the affect it can have on the real estate market. The Fed Funds rate is the interest rate at which banks lend to each other overnight to maintain their reserve requirements. This rate is set by the Federal Reserve, and changes to the rate can have a ripple effect throughout the economy, including the mortgage and housing markets. When the Fed lowers the Fed Funds rate, it can stimulate economic growth by making it cheaper for banks to borrow money, which can lead to lower mortgage interest rates. Lower mortgage rates make it more affordable for homebuyers to finance their purchases, which can increase demand for homes and drive up prices. Conversely, when the Fed raises the Fed Funds rate, it can lead to higher mortgage interest rates, which can slow down the housing market and lead to lower demand and prices.
Next, the the M2 money supply. The M2 money supply includes cash, checking accounts, savings accounts, and other liquid assets that can be easily converted into cash. When the M2 money supply increases, it can stimulate economic activity by making more money available for borrowing and spending. This can lead to lower mortgage interest rates as well, as banks have more funds available to lend out. However, if the M2 money supply increases too rapidly, it can lead to inflation, which can cause mortgage interest rates to rise.
So, as you can see, both the Fed Funds rate and M2 money supply can have a significant impact on the cost of a home mortgage as well as home prices so I would say the answer to the question I posed is “yes”. Granted, we don’t all need to become economists or stay up late at night pouring through spreadsheets and date, but to be aware of factors that affect the economy as a whole and as a result, the real estate market we’re in, would be wise.
How can knowledge of the Fed Funds rate and M2 money supply help me as a home seller or buyer?
The short answer is, it gives you a little insight into perhaps where things are headed which may help you make the decision to buy or sell sooner or later. For example, perhaps you are contemplating buying an home but anguishing over the fact the mortgage interest rates are double what they were a year or two ago and you’re thinking maybe you should wait until things settle down. Well, if you see the Fed Funds rate getting increased with talk of more increases while that is no guarantee mortgage interest rates will increase as well, as I explained above, it’s certainly an indicator that is a likelihood. Therefore, you may decide it’s better to make a move now than later.
What’s an easy way to track this stuff?
I have the answer for you. The charts below are two of the many charts and other information available on St Louis Real Estate Search as well as from MORE, REALTORS® . The first chart shows the relationship historically between St Louis home prices and the M2 Money Supply. Generally, they follow the same trend but, when the trend for one changes, like it did with St Louis home prices (the red line on the chart) beginning in the late 90’s through the housing market bubble burst after 2006, something happens to bring them back in line. As you can see, starting a little over 3 years ago the pace at which M2 was growing outpaced St Louis home prices, but St Louis home prices quickly caught up. Now it’s the opposite and it looks like both a making a downward correction.
The bottom chart shows the close relationship between the Fed Funds rate and mortgage interest rates. With little exception, when the Fed Funds rate increases or decreases, mortgage rates follow. For the past year, the Fed Funds rate has increased and the trend is upward so I wouldn’t expect to see falling mortgage interest rates anytime soon.
Should I rent or buy a home in St Louis? This is a question St Louis REALTORS® are often asked, especially in the past few years while homes appeared to be increasing weekly, there were often more than a dozen offers on a listing and generally the market seemed out of control. Granted, some of that pandemonium has eased somewhat lately given the increase in interest rates and questions about the economy but the question still remains. While there are many non-financial reasons people choose to buy their own home or condo versus rent, we’ll just look at the cost today.
Home prices increased at more than double the rate of rents…
As the chart below, exclusively available from MORE, REALTORS®, shows, the median price of homes sold in St Louis during 2018 was $178,800 and increased to $240,000 in 2022 for an increase of over 34% during the 4-year period. The median rental rate of homes leased in St Louis during 2018 was $1,250 and increased to $1,450 in 2022 for an increase of 16% during the same 4-year period. During this 4-year period the rate at which the price of St Louis homes increased was more than double the rate at which the rental rates of St Louis homes increased.
Factor in interest rates and the cost of home ownership increase and monthly cost of home ownership
As the second chart below shows, mortgage interest rates during 2018 were in the mid-to upper 4’s and in the 6’s and even hit 7% during 2022 so this means in addition to home prices going up, payments went up even more. For the sake of this comparison, we’ll use 4.7% as the rate for 2018 and 6.7% for 2022. Therefore, the payment on a typical home in 2018 (principal and interest only based upon a 5% downpayment) would have been $881 per month and in 2022 increased by 67% to $1,471 per month. So, while the actual price of a home increased 34% during the period the monthly cost of it, in terms of house payment, increased at nearly double that rate, 67%. During the same period rents increased just 16% so the monthly cost of buying a home increased four-times as much.
There were 28,500 homes sold in the St Louis 5-county core market during the 12-month period ended February, 28, 2023 a decline of 16.80% from the prior 12-months when 34,256 homes were sold according to MORE REALTORS® exclusive STL Market Report below. As the report below shows, the median price of homes sold in St Louis increased 7.62% during the same period.
While the supply of St Louis homes for sale is still historically very low, it has increased significantly over the past two years rising from under a 1-month supply to the current 1.64 month supply of homes currently active on the market in St Louis.
Below is our St Louis Real Estate Market Report for February 2023 for the City and County of St Louis combined. You can access the full infographic, containing data for St Charles, Jefferson and Franklin Counties as well by clicking on the image below.
There have been a fair number of reports about the increase in distressed home sales in various markets around the country and on the national level. However, in St Louis, distressed home sales are on the rise, they are still at levels that are historically quite low.
Distressed home sales that involve some sort of distress or other condition that would typically result in the home not selling for a normal “retail” price like it would if it were a typical listing in market ready condition with normal marketing time allowed. The chart below shows distressed home sales in the St Lous 5-County core market over the past years and also shows the 12-month sales trend. For our purposes, we include probate sales, short-sales, foreclosures, and bank and government owned homes as distressed sales. As the chart illustrates, the 12-month sales trend has increased for 5 consecutive months but is still at a level that is significantly lower than it has been for the bulk of the 5-year period illustrated on the chart.
Last week, there were 405 new listings of homes for sale in the St Louis 5-county core market, according to the STL Real Estate Trends Report from MORE, REALTORS®. During the same week, there were 365 new sale contracts written on homes for sale resulting in a new listing to new contract ratio of 1.11. As the tables below illustrate, the only county that had more new sales last week than new listings was Franklin County with 16 new sales and 15 new listings.
Listing supply remains low…
As the table at the bottom shows, as of today, there is just a 1.22 month supply of listings on the market for the St Louis 5-County Core market. While the current months supply is about double what it was a little over a year ago, it is still very low, historically speaking.
For the 12-month period ended January 31, 2023, there were 24,993 homes sold in the St Louis 5-county core market which, as the STL Market Report below (available exclusively from MORE, REALTORS®) shows, is nearly a 17% decline in home sales from the the prior 12-month period when there were over 30,000 homes sold. The median price of homes sold during the most recent 12-month period was $266,500, an increase of 6.6% from the prior 12-month period.
St Louis home sales trend falling fast….
Below the market report is a STL Market Chart showing (also available exclusively from MORE, REALTORS®) the 12-month home sales and home price trend for the St Louis 5-County core market for the past 10 years. The green line on the chart depicts the 12-month sales trend for each month for the past 10-years revealing a decline in the St Louis home sales trend for the past 16-months. The 12-month home sales trend in St Louis is now at the lowest level (24,993 homes) since November 2015 when 12-month St Louis home sales were are 24,772.
St Louis home price trend falling as well….
The red line on the chart depicts the median price per square foot St Louis homes sold at for the 12-month period ending in the month shown. Home prices are seasonal and fluctuate every year, through good markets and bad markets, peaking in early summer and hitting a low in during winter. However, the decline this year, from the peak in June at $189/foot to $172 in January (nearly a 9% decline) is a much larger decline than last year when were was just a 1.7% decline in price during the same period. In 2021 the price decline during the same period was just 1.3% .
A report just released by ATTOM data shows that St Louis home prices are rising at a rate significantly higher than the rate wages in St Louis are rising and St Louis rental rates are increasing at rates higher than home prices. As the chart below shows, during the past year, wages in the St Louis metro area increased 3.8% however, home prices in St Louis increased 7.9% and rental rates increased 11.2%.
The median price of homes sold in Franklin County increased from 2021 to 2022 at nearly double the rate the price of homes sold in St Louis County did during the same period. As the chart below shows, the median price of homes sold in Franklin County during 2021 was $206,000 and then increased 6.7% to $219,800 in 2022. During the same period, the median price of homes sold in St Louis County increased 3.4% from 246,500 to $255,000.
Kind of an attention-getting headline, huh? At least it’s not as bad as a lot of the gloom and doom headlines I’m reading today about the real estate market. Many folks out there are predicting a total meltdown of the housing market, and our economy as a whole for that matter. Don’t get me wrong, I’m not drinking the “there’s nothing to see here” Kool-Aid, I do believe we are in for some rough times ahead, I am just not convinced it’s going to be as bad here in St Louis as in many parts of the country.
So back to the falling St Louis home prices and sales…
As the infographic below shows, the median price on homes sold in St Louis dropped 12.7% from June to December of last year and, during the same 6-month period, St Louis home sales declined 40%. But, “I thought you said you weren’t gloom and doom?”. Granted, this data doesn’t sound good but remember, the residential real estate market is very seasonal. Prices and sales go up in the spring and down in the winter every year, during good markets and bad. So, since June is often the peak of the market in terms of sales and prices, and December or January the trough where prices and sales fall to the lowest levels, this is normal. The question is, whether the amount home prices sales declined in the past 6-months is pretty typical? As the infographic below illustrates both the decline in price and sales were the largest declines in the past 5-years. The decline in sales in 2018 was close to this past year and the decline in prices in 2019 was close to this past year, but 2022 saw larger declines in both.
It’s something to watch close but not time to panic yet…
While the seasonal decline now is greater than is typical, it certainly is not as bad as some markets are seeing. The big question is what is going to happen in the next couple of months? Typically January sees another decline in sales from December and a slight decline in price and February is about the same or sometimes starts to show an uptick in prices. So, depending upon how things turn out this month and next we’ll have a better idea of whether we’ll see the normal recovery from the winter season or if we’ll see the market continue to deteriorate.
Even though the number of new home building permits in the St Louis area has been on the decline, they’re been on the increase in the midwest region of which St Louis is a part. As the chart below illustrates, for the 12-month period ended last month, there are been 2,850 building permits issued for new privately-owned housing units in the midwest region of the U.S. an increase of 3.6% from he prior 12-month period when there were 2,746 permits issued. For just the month of November 2022, there were 197 permits, down nearly 8% from November 2021 when 214 permits were issued.
New home construction starts on the rise as well…
Depicted also on the chart below is the number of new homes where construction has actually begun, referred to as “starts”. The number of starts always tends to be lower than the number of permits issued as there are many issues that could arise that would cause a home not to be built even though a permit was issued for it. One of those issues could be the developer or builder’s sentiment about the market which, if trending unfavorably, may cause the developer to postpone adding to inventory. However, even though we saw builder sentiment decline every month this year, the number of new home starts in the midwest region for the most recent 12-month period increased 5% from the prior 12-month period. There were 2,657 new home starts in the 12-month period ended last month compared with 2,523 starts during the prior 12-month period. For just November 2022, there were 215 starts, down just one from November 2021 when there were 216 starts.
There were 900 homes and condominiums “flipped” during the third quarter in the St Louis M.S.A., according to data just released by ATTOM Data Solutions. As the chart below illustrates, these flips represent 6.6% of all sales during the 3rd quarter of 2022, a decrease of 28.8% from the prior quarter but an increase of over 15% from a year ago.
Missouri Online Real Estate, Inc. 3636 South Geyer Road - Suite 100, St Louis, MO 63127 314-414-6000 - Licensed Real Estate Broker in Missouri
The owner and authors this site are providing the information on this web site for general informational purposes only and make no representations, warranties (expressed or implied) or guarantees of any kind whatsoever, as to the accuracy or completeness of any information on this site or of any information found by following any link on this site. Furthermore, the owner and authors of this site will not be liable in any manner whatsoever for any errors or omissions in information on this site, nor for the availability of this information. Additionally the owner and authors of this site will not be liable for for any losses, injuries or damages in any way from the display or use of this information or as the result of following external links displayed on this site, or by responding to advertisements displayed, or contained, on this site
In using this site, users acknowledge and agree that the information on this site does not constitute the provision of legal advice, tax advice, accounting services, investment advice, or professional consulting of any kind nor should it be construed as such. The information provided herein should not be used as a substitute for consultation with professional tax, accounting, legal, or other competent advisers. Before making any decision or taking any action on this information, you should consult a qualified professional adviser to whom you have provided all of the facts applicable to your particular situation or question. None of the tax information on this web site is intended to be used nor can it be used by any taxpayer, for the purpose of avoiding penalties that may be imposed on the taxpayer.
All of the information on this site is provided as is, with no assurance or guarantee of completeness, accuracy, or timeliness of the information, and without warranty of any kind, express or implied, including but not limited to warranties of performance, merchantability, and fitness for a particular purpose.
This site contains external links to other sites not owned or controlled by the owner of this site, therefore the owner of this site does not control or guarantee in any manner the accuracy or relevancy of any information obtained through following such links. Links contained on this site are for users convenience and users should exercise extreme caution when following links. Including a link on this site does not constitute an endorsement of the site linked to or any views or opinions expressed on the site, products or services offered on outside sites or the companies or organizations that own and operate outside sites.
This site may accept payment for advertising, for displaying advertisements, through affiliate relationships with companies or may receive referral fees or commissions from companies as a result of recommending or referring people to a website. This site may also accept free product samples, free services, gift cards or cash to review a product or service. All paid and sponsored content may not always be identified as such. Any product claim, quote or other representation about a product or service should be verified with the manufacturer or provider.


")


