By Dennis Norman, on February 7th, 2023 According to data released by ATTOM Data Research, during the fourth quarter of 2022, 42.37% of the homeowners with a mortgage within the 63376 zip code, were “equity-rich” meaning their mortgage balance was just 50% or less of the current value of their home. The table below shows the 10 St Louis zip codes with the highest percentage of equity-rich mortgages. Half of zip codes on the list are located within the St Charles County, four in St Louis County and one in Jefferson County
Also shown on the table is the percentage of homeowners with a seriously-underwater mortgage, meaning their loan balance is 125% or more of the current home value.
[xyz-ips snippet=”Homes-For-Sale-and-Listings-With-Virtual-Tours”]
St Louis Seriously Equity-Rich Homeowners By Zip Code – Top 10 Highest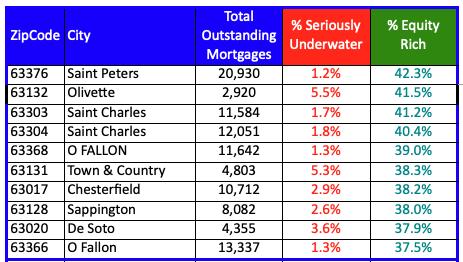
By Dennis Norman, on February 6th, 2023 According to data released by ATTOM Data Research, during the fourth quarter of 2022, 35.7% of the homeowners with a mortgage within the 63118 zip code, were seriously underwater on their mortgage, meaning their mortgage balance exceeds the value of their home by 25% or more. The table below shows the 10 St Louis zip codes with the highest percentage of seriously underwater mortgages. Half of zip codes on the list are located within the City of St Louis and the other half are located in North St Louis County.
Also shown on the table is the percentage of homeowners with an equity-rich mortgage, meaning their loan balance is 50% or less of the current home value. Six of the 10 zip codes on the list have a higher percentage of equity-rich mortgages than that of seriously underwater mortgages.
[xyz-ips snippet=”Homes-For-Sale-and-Listings-With-Virtual-Tours”]
St Louis Seriously Underwater Homeowners By Zip Code – Top 10 Highest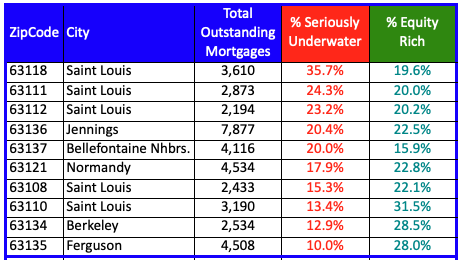
By Dennis Norman, on December 20th, 2022 Today, the Consumer Financial Protection Bureau (CFPB) released details of a Consent Order they reached with Wells Fargo Bank, N.A. in which Wells Fargo is ordered to pay “more than $2 billion in redress to consumers and a $1.7 billion civil penalty for legal violations across several of its largest product lines.” According to a press release issued by the CFPB, Wells Fargo’s “..illegal conduct led to billions of dollars in financial harm to its customers and, for thousands of customers, the loss of their vehicles and homes.” Rohit Chopra, the Director of the Consumer Financial Protection Bureau, stated “Wells Fargo’s rinse-repeat cycle of violating the law has harmed millions of American families”.
The CFPB order requires Wells Fargo to:
- Provide more than $2 billion in redress to consumers: Wells Fargo will be required to pay redress totaling more than $2 billion to harmed customers. These payments represent refunds of wrongful fees and other charges and compensation for a variety of harms such as frozen bank accounts, illegally repossessed vehicles, and wrongfully foreclosed homes. Specifically, Wells Fargo will have to pay:
- More than $1.3 billion in consumer redress for affected auto lending accounts.
- More than $500 million in consumer redress for affected deposit accounts, including $205 million for illegal surprise overdraft fees.
- Nearly $200 million in consumer redress for affected mortgage servicing accounts.
- Stop charging surprise overdraft fees: Wells Fargo may not charge overdraft fees for deposit accounts when the consumer had available funds at the time of a purchase or other debit transaction, but then subsequently had a negative balance once the transaction settled. Surprise overdraft fees have been a recurring issue for consumers who can neither reasonably anticipate nor take steps to avoid them.
- Ensure auto loan borrowers receive refunds for certain add-on fees: Wells Fargo must ensure that the unused portion of GAP contracts, a type of debt cancellation contract that covers the remaining amount of the borrower’s auto loan in the case of a major accident or theft, is refunded to the borrower when a loan is paid off or otherwise terminates early.
- Pay $1.7 billion in penalties: Wells Fargo will pay a $1.7 billion penalty to the CFPB, which will be deposited into the CFPB’s victims relief fund.
To get more information on the CFPB victims relief fund, click here.
Wells Fargo employees who are aware of other illegal activity are encouraged to send information about what they know to whistleblower@cfpb.gov.
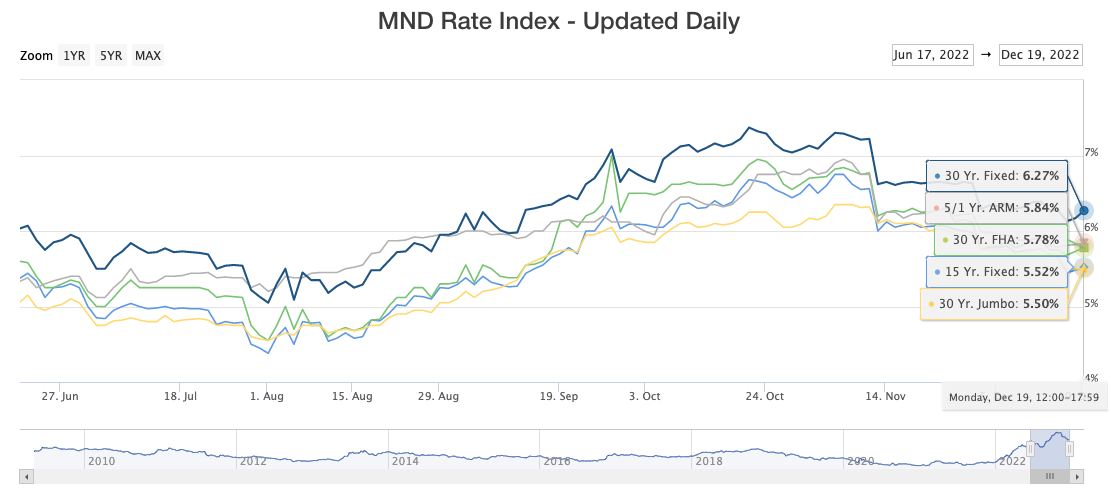
By Dennis Norman, on December 20th, 2022 As the chart below illustrates, yesterday, mortgage interest rates on a 30-year fixed rate conventional mortgage increased slightly to 6.27% after dropping to 6.13% last Thursday, the lowest level in over 3 months.
Historically-speaking, it’s not that bad….
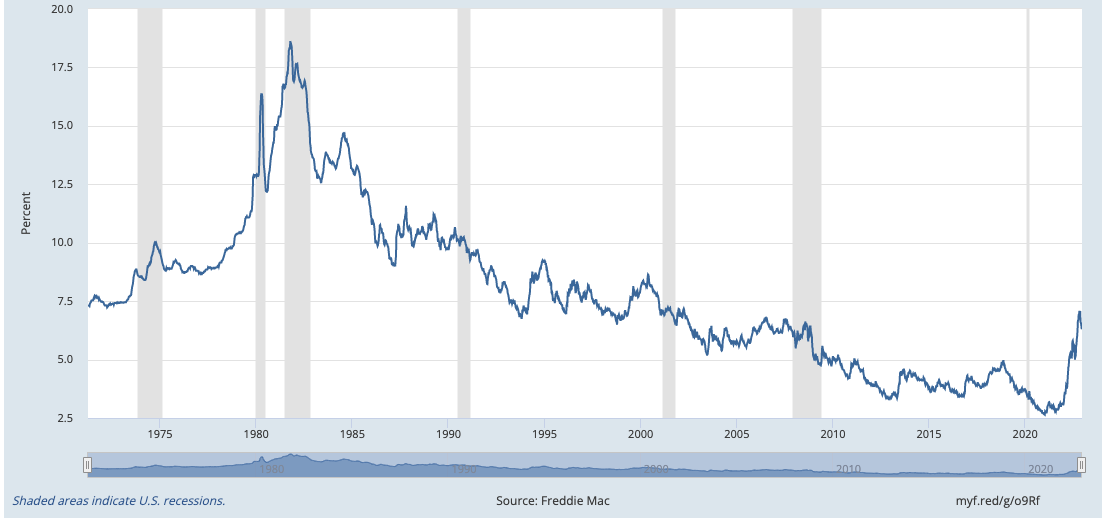
Granted, no one really wants to hear this, but, if we look at the bigger picture (like the bottom chart that goes back to 1971) we’ll see that our current mortgage interest rates aren’t that high. In fact, over the 52-year period depicted on the chart, about 70% of the time mortgage interest rates were higher than they are now. If you’re in your 20’s or 30’s you likely don’t care and still think the rates suck since they are about double what they have been since you have paid attention to them. If you’re a baby-boomer like me, it’s a walk down memory lane LOL.
Mortgage Interest Rates Based Upon the MND Rate Index
(click on chart for live, interactive chart)
30-Year Fixed Rate Mortgage Interest Rates 1971-Present
(click on chart for live, interactive chart)
By Dennis Norman, on December 2nd, 2022 This week the Federal Housing Finance Administration (FHFA) announced that the limits for all conforming home loans to be acquired by Fannie Mae and Freddie-Mac (most of the conventional home loans originated) will increase to $726,200 on January 1, 2023. This is an increase of $79,000 for the current loan limit of $647,200.
Also this week, the Federal Housing Administration (FHA) announced that the limits for all FHA loans will increase to between $472,030 and $1,089,300 for single-family homes depending on the area the property is located in. Below are the limits for the low cost mortgage areas as well as high-cost mortgage areas:
Low Cost Area: (The entire state of Missouri falls into this category)
-
- One-unit: $472,030
- Two-unit: $604,400
- Three-unit $730,525
- Four-unit: $907,900
High Cost Area:
-
- One-unit: $1,089,300
- Two-unit: $1,394,775
- Three-unit 1,685,850
- Four-unit: $2,095,200
The Veteran’s Administration, as of 2020, removed the lending limit for veteran’s with full entitlement so there remains no limit on VA loans.
[xyz-ips snippet=”Traci-Everman—FHA-VA-Loan-Specialist”]
By Dennis Norman, on November 25th, 2022 As the chart below illustrates, on November 10th, mortgage interest rates on a 30-year fixed rate mortgage dropped sharply from 7.22% the day before to 6.62% on the 10th. Since dropping, interest rates have remained around the 6.6% level.
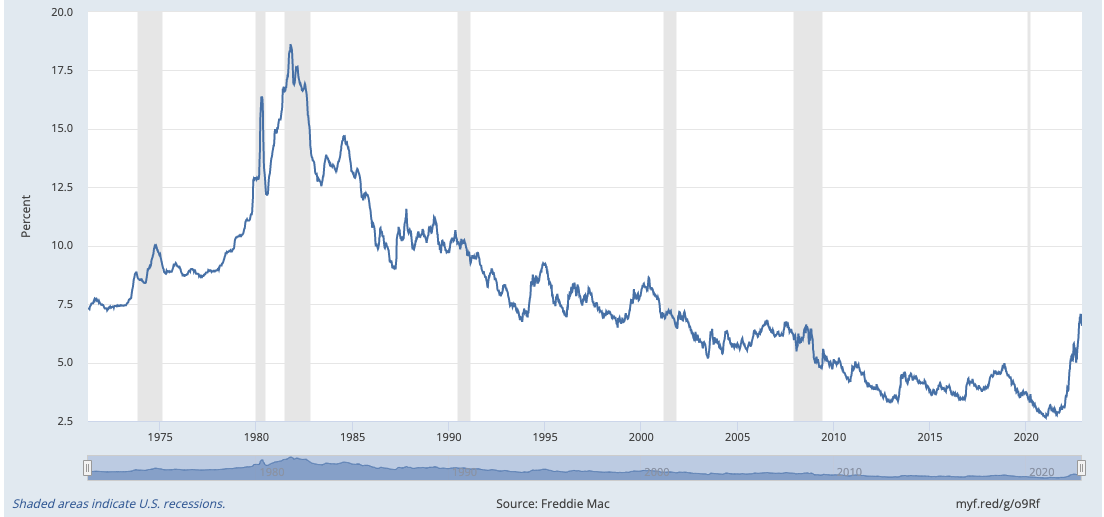
Historically, the current rates are not bad, but that does lessen the impact…
As the bottom chart below shows, interest rates have been above the current levels for over half the period. However, understandably, that doesn’t mean much to first-time home buyers or younger homebuyers as for over the past 10 years the rates have been much less, even to the point of hitting all-time lows in the mid 2’s.
Mortgage Interest Rates Based Upon the MND Rate Index
(click on chart for live, interactive chart)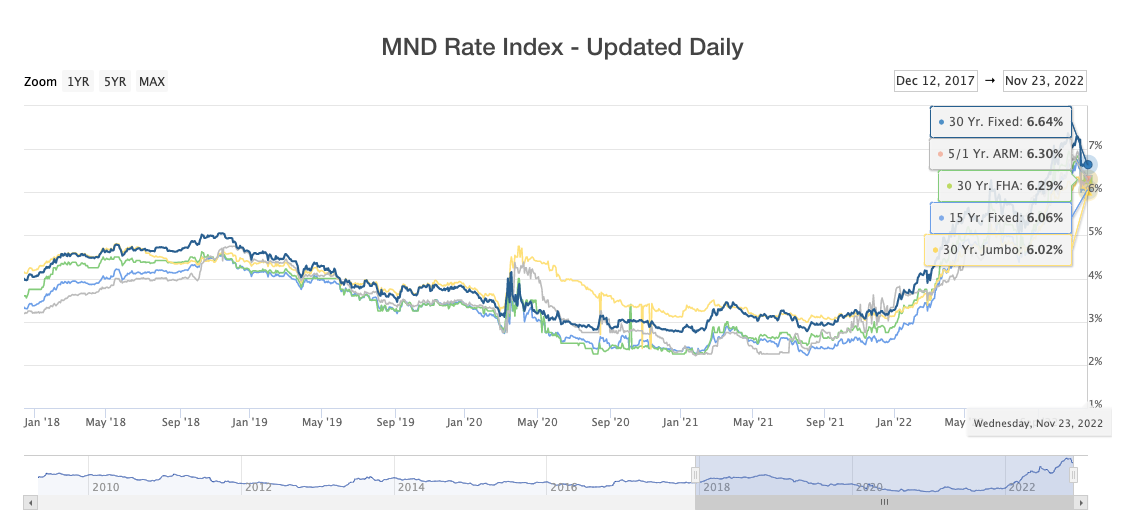
30-Year Fixed Rate Mortgage Interest Rates 1970-Present
(click on chart for live, interactive chart)
By Dennis Norman, on October 13th, 2022 Yesterday, Fannie Mae released their October housing forecast in which they forecast, among other things, where home sales and prices are headed. The report incudes a forecast for next year, which included:
- Home prices in 2023 to decline 1.5% from 2022
- Home sales to finish 2022 down nearly 18% from last year and drop another 22% in 2023
- New home construction to end 2022 down 3.6% from last year and drop another 25% in 2023.
- Mortgage Interest Rates will continue to rise the rest of these year, ending the year at 6.7% and then will ease back to 6.4% in 2023.
See Fannie Maes Complete Housing Forecast HERE
By Dennis Norman, on October 6th, 2022 A little over two weeks ago I wrote my most recent article addressing St Louis home prices titled “Will St Louis Home Prices Decline?” in which my short answer was “yes”, but kind of tongue in cheek and based upon the seasonality of home prices, but my longer answer was more vague. I mentioned that there certainly is a correction coming but pointed out that there are so many variables that will affect prices that it is hard to say to what extent this correction will be. While this is still true, a lot has happened in the short time period since that article that has caused me to become more bearish on the St Louis real estate market to the point where I’m confident St Louis home prices will decline.
What has changed in the last 16 days…
- While it doesn’t directly impact the St Louis market, hurricane Ian has wreaked havoc on a lot of Florida and other areas and will no doubt impact the overall housing market and economy and likely in more of a negative way.
- Interest rates have risen another 1/2% hitting and staying near 7%.
- The Mortgage Bankers Association (MBA) just announced that mortgage applications dropped over 14% during the last week of September, the biggest one-week drop in 17 months and pushed their index down to the lowest point since 1997.
- The percentage of active listings that have reduced the asking price at least once broke the 40% mark.
- The 12-month home sales trend for St Louis for the period ending September 30, 2022 fell to the lowest point in over 2-years.
- Active listings in St Louis have been for sale a median of 43 days over four times higher than the median time to sell during the past 2 years of 10 days.
Market data pointing to lower St Louis home prices…
- The declining sales trend mentioned above. As chart 1 below shows, home sales during September in St Louis were down nearly 19% from last September.
- The declining home price trend. Chart 1 also reveals the median price of homes sold during September 2022 was $267,500, only 2.8% from then September 2021 when the median sold price was $260,000 which was a 8.3% increase from September 2020 when the median price was $240,000.
- Showings on active listings continues to decline. Chart 2 shows there are almost 10% fewer showings of active listings now then there were in the first week of January (the slowest time of the year). Last year at this time showing activity was over 30% higher than now and in 2020 it was abut 55% higher. Fewer showings mean fewer sales in coming.
- The widening gap between home prices and rental rates. Chart 3 shows the home price index (blue line) rising above the rental rates (red line) at a fairly steep rate. Historically, such as the late 1980’s – 2000 shown on the left side of the chart, these two lines track closely with home prices slight below the rental rates line. The last time home prices started increasing more than rents was in the early 2000’s and this continue until the gap widened to the point that something had to give…either home prices had to fall or rents had to increase. In 2008, the bubble burst and home prices fell. While the present gap is not as large as it was during the height of the housing market bubble in 2006-07, we’re headed that way.
- CPI and St Louis Home Price Index are hitting bubble levels. Chart 4 shows the rate of change (year over year) in CPI and the St Louis home price index. The rate of change in both has already exceeded what in the past (with the exception of 1979 when it went a little higher) has triggered home prices to fall.
- Home price and interest rate increases are killing St Lous home affordability. Table 5 shows that currently, based upon median home prices and interest rates, one year of house payments (principal and interest only) take about 30% of the median household income for St Louis. In 2007, at the peak of the housing bubble, it was only 21% and in 2000, which many economists use as a “normal” or baseline year, it was 20%. So the real cost of a typical St Louis home to a typical St Louis family is about 50% higher now than normal.
Continue reading “Why St Louis Home Prices Are Going To Decline“
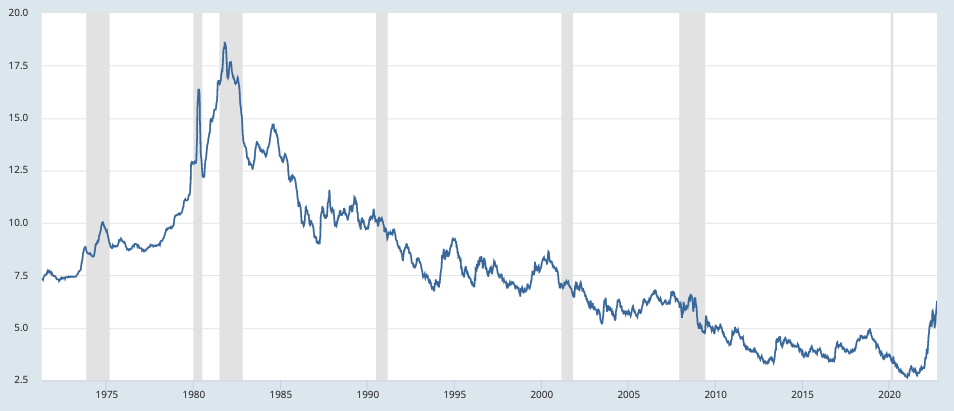
By Dennis Norman, on September 27th, 2022 Today, the interest rate for a 30-year fixed-rate mortgage hit 7.08% marking the first time in over 20-years the rate has gone above 7%. Historically speaking, as the 2nd chart shows, this is not that high of an interest rate and, in fact, lower than the median rate over the past 50 years, however, it’s a very high rate based upon the the recent past.
The affect of interest rates on home prices…
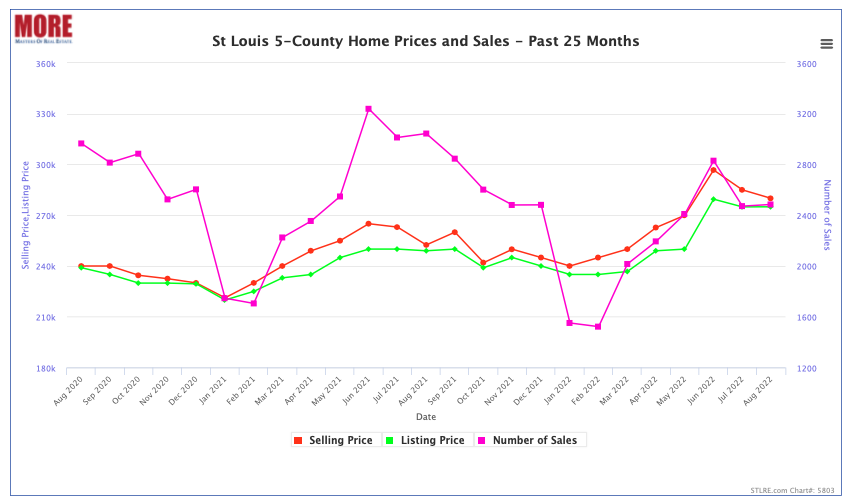
Interest rates just began increasing in the past few months, rising above the 4% level in February, so it will take time to see the impact of this on home prices. We’re beginning to see the effect in prices somewhat, particularly with the decrease of “overbids” and an increase in reduced prices on active listings, but nothing too dramatic yet. For example, as the bottom chart shows, the median price of homes sold in St Louis in August was $280,000, a nearly 11% increase from the median price of $252,450 a year ago. Since home prices typically peak around June, they are usually lower in August than June or July. If we examine this to see if perhaps there was a bigger decline in those months this year than last we find that last year prices dropped 3/4 of 1% from June to July and then dropped 4% from July to August, for a total decline of 4.7% from June’s peak to August. This year, prices dropped 3.9% from June to July, then 1.7% from July to August for a total decline of 5.6%, only slightly higher than last year. I do think we’ll see a larger impact than this, but thus far it’s not so bad.
Mortgage Interest Rates Based Upon the MND Rate Index
(click on chart for live, interactive chart)

30-Year Fixed Rate Mortgage Interest Rates 1970-Present
(click on chart for live, interactive chart)
St Louis 5-County Core Home Prices and Sales – Past 25 Months
(click on chart for live, interactive chart)
By Dennis Norman, on September 20th, 2022 The short answer is yes. They decline every year as we head into winter due to the seasonal nature of the business. If you look at the first chart below which depicts the median price of homes sold in the St Louis 5-County core market since 1998, you will notice a very consistent pattern of prices rising in the spring and summer, then declining in the fall and winter. For the most part, the other pattern you will see is that the peak each spring is higher than the spring before and the bottom each winter is higher than the winter before, but there are exceptions to that such as after the bubble burst in 2008.
So, as we head into the fall season, we can expect home prices to decline. The question is, given all that is going on in the economy, including mortgage interest rates in excess of 6%, will the decline be more than the typical “seasonal adjustment”? To address this, the first thing we can look at is the percentage decline we’ve seen in the recent past from the summer peak to September which is as follows:
- 2019 – Summer peak to September –10.9%
- 2020 – Summer peak to September – 0% (no change)
- 2021 -Summer peak to September –1.9%
- 2022 -Summer peak to September –10.2%
What this reveals is this years decline, while definitely larger than the last two years, is actually less than the decline in 2019 (which was a good market) so this doesn’t jump out as particularly alarming. I think it’s worth saying that we are no doubt going to have a market “correction” or “adjustment” at a minimum because home prices could not simply keep increasing like they have been so this years seasonal adjustment may just be a return to normal. Having said that though, since the “bottom” of the winter market price-wise doesn’t usually come until January or February, we will need to watch the next couple of months to see if this downward price trend remains consistent with historic norms or in fact picks up steam and looks like it’s headed for a bigger decline than normal. My guess is at this point it the latter. While I’m not a “gloom and doomer” in fact, I like to think of my self as an opportunist and see opportunities in challenging markets, I just think I’m being realistic. There are a lot of moving balls in the air right now with regard to our economy and more unknowns than certainties in my opinion.
We can’t underestimate the impact of interest rates either…
Continue reading “Will St Louis Home Prices Decline?“
By Dennis Norman, on August 5th, 2022 I saw dozens and dozens of headlines yesterday reporting that mortgage interest rates had fallen below 5% on a 30-year fixed rate mortgage. The catch is on the day that was reported, yesterday, interest rates were actually above 5% on a 30-year fixed-rate loan. As our chart below shows, the MND Rate index was reporting 5.09% and, below that, Optimalblue was reporting 5.326%. Both of the aforementioned charts are updated daily and considered by many in the industry to have the most current and accurate information.
How could all the big headlines be wrong?
Well, actually the articles I scanned were not wrong in what they were reporting, the headline would just give many home buyers a different impression perhaps than what was actually being reported. What prompted the headlines was yesterday, like every week on Thursday, the Freddie Mac Primary Mortgage Market Survey® (PMMS®) results were released. In Freddie Mac’s report, it showed the average 30-year fixed rate mortgage was 4.99% (see the Freddie Mac chart at bottom). The catch is, the survey is done from Monday through Wednesday of the week and then the results reported on Thursday. Many lenders submit their rates to Freddie Mac on Monday meaning by the time the report comes out they are 3-days old. A lot happens in the mortgage market in 3-days, in fact a lot can happen during one day. Oh yeah, the other thing worth noting is if you read the details on the Freddie Mac survey the stated rate was only obtained by paying 0.80 in points, so 8/10 of 1% of the loan amount would be paid up front to get that rate.
Freddie Mac’s Survey Is Very Valuable and Relevant
[xyz-ips snippet=”Interest-Rates-and-Mike-McCarthy-Promo”]
Continue reading “Yesterday’s Headlines Say Interest Rates Are Below 5 Percent – Why They Were Wrong“
By Dennis Norman, on July 22nd, 2022 Interest rates on a 30-year fixed-rate mortgage peaked at 6.28% a little over a month ago on June 14th, sending shockwaves through the St Louis housing market. After peaking however the rates have subsided, today dropping to 5.5%, the lowest rate since July 5th. This decline brings the mortgage rates down to the range they were I for most of May this year.
Mortgage Interest Rates
(click on chart for live, interactive chart)

By Dennis Norman, on July 6th, 2022 It’s no secret that the real estate market slows down in the winter and typically nearly screeches to a halt from shortly before Christmas to shortly after New Years. Therefore, when tracking showing activity in the St Louis area, the first week of January of each year is used as the base, or “0” value and then each rolling 7-day period afterward is compared to that first week.
As the chart below shows, in 2020 and 2021 all weekly averages of showing activity were above the baseline of January until getting close to Thanksgiving, with the one exception being late March and Early April of 2020 which was a result of the COVID-19 pandemic beginning. The orange line depicts this year and it shows showing activity all year has been below the levels of the prior two years for the most part, however, the gap has widened in the past couple of weeks. On July 4th, for the prior 7-day period the number of showings was less than the first week of January and it dipped further on July 5th to 6.9% fewer showings during that 7-day period than the first week of January. Granted, it is always going to dip around a holiday but last year for the period ended July 5th there were 9.1% more showings than the first week of January, for a difference of 16% from this year.
Rising interest rates and increased inflation are no doubt two of the big reasons for this along with a low inventory of homes for sale.
Continue reading “Showings Of St Louis Listings Fall To Levels Below January“
By Dennis Norman, on June 23rd, 2022 After hitting the highest rate in over 13 years just two weeks ago at 6.28%, as the chart below shows, mortgage interest rates on 30-year fixed mortgages declined today to 5.75%. The likelihood of interest staying under 6% is hard to to say at this time but I would say enjoy it while it lasts!
Mortgage Interest Rates – 30 and 15-Year Conventional Loans, FHA Jumbo and and 5/1 ARM Loans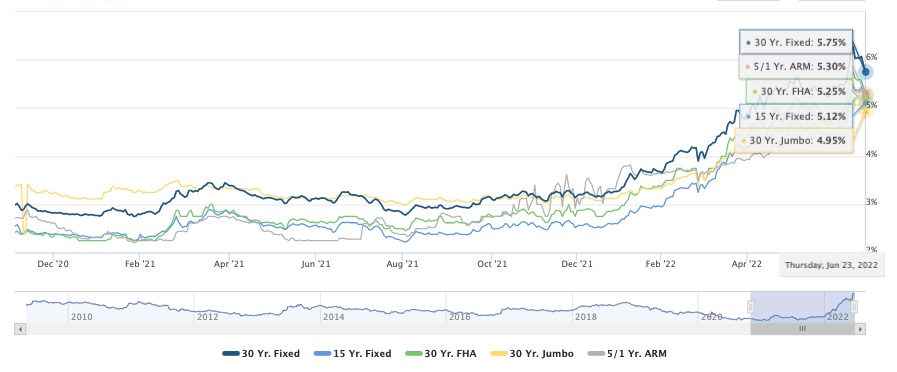
By Dennis Norman, on June 16th, 2022 For the first three weeks of June there were 1,475 new listings of homes for sale in the St Louis 5-county core market, according to the STL Real Estate Trends Report from MORE, REALTORS®. During the same period, there were 1,194 new contracts written on homes for sale resulting in a new listing to new contract ratio of 1.25. This ratio of listings to new sales is higher than it was 3 weeks ago when I shared the last update from the STL Real Estate Trends report and it was 1.05 at that time for the period reported which was the first 3 weeks of May.
It was at the end of last week that the mortgage bond market blew apart forcing mortgage interest rates up so when our new report for this week is release next Thursday we’ll see what effect that had on the market.
Continue reading “New Listings To New Contracts Ratio Increases This Month“
By Dennis Norman, on June 15th, 2022 After over 40 years in the real estate business in St Louis I’ve seen many times just how fast a good, or even great housing market can turn sour as well as the other way around. Two years ago, economic conditions relevant to the housing market included:
Today, the above conditions are:
Does this mean St Louis home prices will come crashing down?
First off, I’m not an economist, in fact I didn’t even attend college and I certainly don’t have a crystal ball showing me the future, but I am a data junkie that has lived through a variety of markets spanning more than 4 decades. My experience as well as my study of past markets as well as current indicators of things to come certainly give me an opinion. In times past, my opinions on the market have been spot on, almost to the point that I even surprised myself (such as in October 2006, at the peak of the housing boom when I predicted the collapse) and other times I’ve been wrong, sometimes way wrong. The reality is that the housing market is affected, or can be affected by so many different economic factors, as well as social issues, consumer sentiment and more that I don’t believe anyone can predict what it’s going to do accurately consistently.
Continue reading “Will Home Prices Come Crashing Down?“
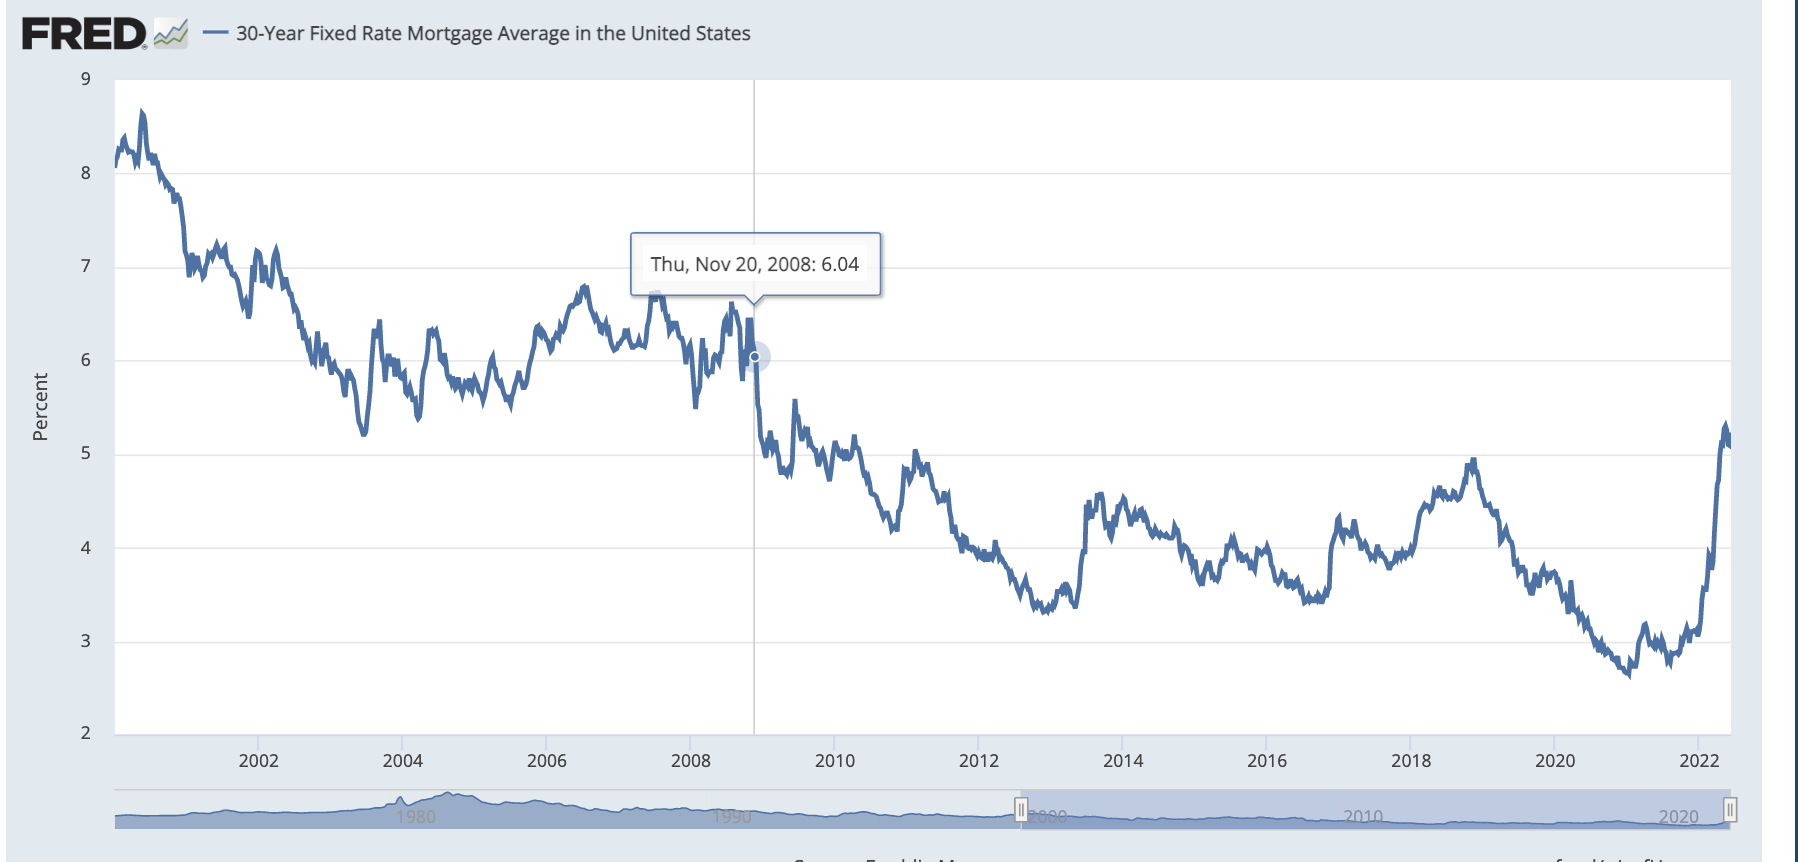
By Dennis Norman, on June 14th, 2022 The bond market had one of the worst days in history yesterday resulting in mortgage interest rates on a 30-year fixed rate mortgage hitting 6.0% and above. This is the highest rates have been since November 20, 2008 when the mortgage interest rates were 6.04%, according to Freddie Mac’s Primary Mortgage Market Survey®.
Is there a silver-lining to the higher interest rates?
Given that the reason for the higher interest rates has to do with our high inflation rates and declining economic conditions, it’s hard to find much positive to say about what is happening. Having said that, the one thing that comes to mind is these rate increases will no doubt slow down the rapid price growth on homes we’ve seen over the past couple of years. This will likely cause home prices to flatten and the premiums buyers have paid over and above what the buyer, seller and agents involved knew the home was actually worth are history in my opinion.
So, while as a buyer, you will be facing higher interest rates than you would have a year ago, you should receive some relief in the price not being as high as it would have if the low rates were still here, less competition due to some buyers leaving the market and being able to purchase a home without paying a significant premium above the value to get it.
Mortgage Interest Rates – 2000-Present- 30-year fixed rate mortgage
(click on chart for live, interactive chart)
By Dennis Norman, on June 9th, 2022 There were 2.71 million home loan originations during the first quarter of this year in the U.S., according to the U.S. Residential Property Mortgage Origination Report from ATTOM. This is an 18% decline from the prior quarter, the largest quarterly decline since 2017 and marks the fourth straight quarterly decline in loan originations according to the report.
Refinancing saw a bigger decline than home purchases…
During the first quarter of this year there were 1,446,622 loans originated that were refinances of existing mortgages which is a decline of 21.7% from the prior quarter. There were 1,011,975 loans originated for home purchases during the quarter and this was down 18.3% from the prior quarter.
St Louis is the metro that saw the second-highest decline…
I according to the report the metro area with the largest quarterly decrees and loan origination’s for home purchases was Huntsville Alabama with a 61.3% decrease followed by St Louis Missouri with a 55.3% decrease.
[xyz-ips snippet=”Interest-Rates-and-Mike-McCarthy-Promo”]
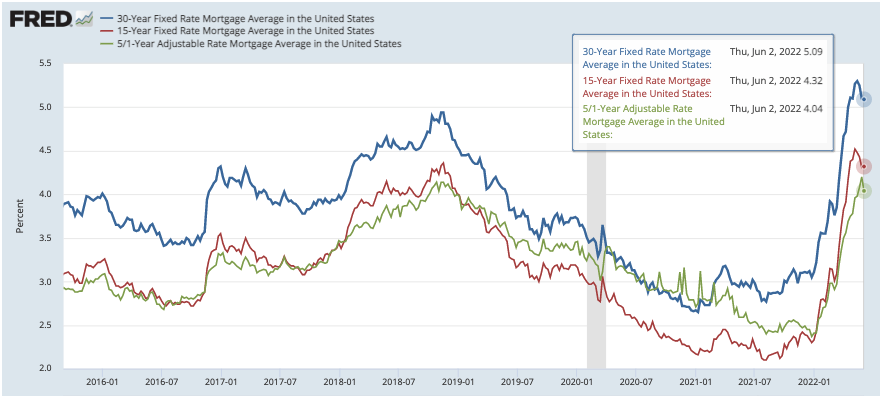
By Dennis Norman, on June 7th, 2022 On May 12th the 30-year fixed rate mortgage interest rate hit 5.3%, the highest rates since June 2009, according to Freddie Mac’s Primary Mortgage Market Survey®. As the chart below illustrates, mortgage interest rate have declined the last three consecutive weeks falling to 5.09% at the end of last week, the lowest rate since April 14th when the average interest rate was 5.0%.
Mortgage Interest Rates – 30 and 15-Year Conventional Loans and 5/1 ARM Loan
(click on chart for live, interactive chart)
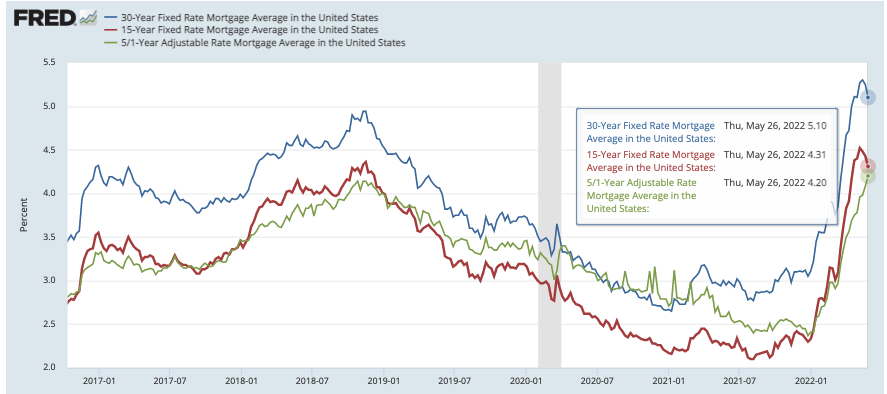
By Dennis Norman, on May 27th, 2022 On May 12th the 30-year fixed rate mortgage interest rate hit 5.3%, the highest rates since June 2009, according to Freddie Mac’s Primary Mortgage Market Survey®. As the chart below illustrates, mortgage interest rate have declined the last two consecutive weeks falling to 5.10% yesterday, the lowest rate since April 28th.
There are more affordable options…
The chart I selected to show below also shows the mortgage interest rates for 15-year mortgages as well as something almost no one has had a reason to talk about for several years, adjustable rate mortgages (ARM’s). With mortgage interest rates as low as they were, ARM’s were rarely considered by a purchaser however, today they provide a more affordable option than a 30-year fixed mortgage. For example, the 5/1 arm shown on the chart below had a rate of 4.2% yesterday.
Mortgage Interest Rates – 30 and 15-Year Conventional Loans and 5/1 ARM Loan
(click on chart for live, interactive chart)
By Dennis Norman, on May 9th, 2022 There have been a lot of reports over the past month about rising interest rates (mortgage rates on a 30-year fixed-rate mortgage hit 5.27% last week) as well as rising inflation rates (8.5% in March) and the effect these things will have on the housing market. It’s no doubt they will have some affect on home prices and sales and I have been watching the data on St Louis home prices and sales closely and so far there does not appear to be much impact.
St Louis home sales increase in April from March…
There are two ways we analyze home sales at MORE, REALTORS®; the traditional manner, which is what almost all public reports are based upon, closed sales (which are really indicative of what the market was like 1-2 months previously since that is when the contracts were typically written) and then by use of our STL Real Estate Trends Report, which gives us a better idea of the current activity. Our trends report shows the number of new contracts written on listings, so current sales activity as well as the number of new listings entering the market. The good news is, when looking at St Louis home sales activity for April, both closed sales and newly written contracts increased from the month before.
As our chart below shows, there were 2,134 homes sold in St Louis (5-county core market) during April, a 6.4% increase from March when there were 2,005 homes sold. As the STL Real Estate Trends Report shows, there were 3,279 new contracts written on homes during April in the St Louis 5-county core market, an increase of 5% from the prior month when there were 3,124 contracts written.
Continue reading “St Louis Home Sales Doing Well In Spite of Rising Interest Rates & Inflation“
By Dennis Norman, on April 29th, 2022 Last week there were 551 new contracts written for the sale of listings in the St Louis 5-county core market down over thirty-six percent (31.3%) from the week before when there were 802 new contracts written, according to the STL Real Estate Trends Report, exclusively available from MORE, REALTORS®. The new sales activity last week was down even more (nearly 36%) from the same week a year ago when there were 851 new contracts written on listings. There is no doubt this is the result of mortgage interest rates which have nearly doubled in the last 15 months.
New listings on the other hand increased last week to 851 from 618 the week before. The new listing activity is pretty much in line with the same week a year ago when there were 858 new listings. If this trend continues the listing supply will likely increase significantly. Given that the for the 5-county core market its been under 1 month for a long time, it can afford to increase some.
The current week will be very telling. When we see data next week from this week, if the numbers are similar to what we saw last week, it’s a likely indicator of a market shift to some extent. Time will tell..
Continue reading “New Sales Last Week Declined Over Thirty Percent From The Week Before“
By Dennis Norman, on April 14th, 2022 This week it was announced that the U.S. inflation rate in March had increased to a staggering 8.5% the highest rate in over 40 years as illustrated by the chart below. The last time the inflation rate was higher than this was in December 1981 when it hit 8.9%. The “inflation rate” that I’m referring to, and is the most commonly reported, is based upon the Consumer Price Index for All Urban Consumers (CPI-U): U. S. city average. One of the categories included in the CPI-U is “shelter”. The report shows the shelter inflation rate at 5% which, on the surface sounds low however, the median price of homes sold in St Louis in March was $250,000 an increase of just over 4% from March 2021 when the median sold price was $240,000.
What does an inflation rate of 8.5% mean for the real estate market?
With everything going on in our economy, country and world now I think it’s literally impossible to predict what is going to happen on any front with any level of accuracy however, a good guide would be what has happened in the past during similar times. With this in mind, lets look at what the market looked like the last time inflation was at this level, December 1981:
- Mortgage interest-rates on a 30-year fixed mortgage were an average of 17%-18% (see chart below)
- The inflation rate actually reached a peak of 14.4% in March of 1980
- St Louis home prices peaked during the 1st quarter of 1979 then declined until bottoming-out during the 2nd quarter of 1981 (see chart at bottom)
Continue reading “Inflation Rate Increases to 8.5 Percent in March…What will the effect be on home prices?“
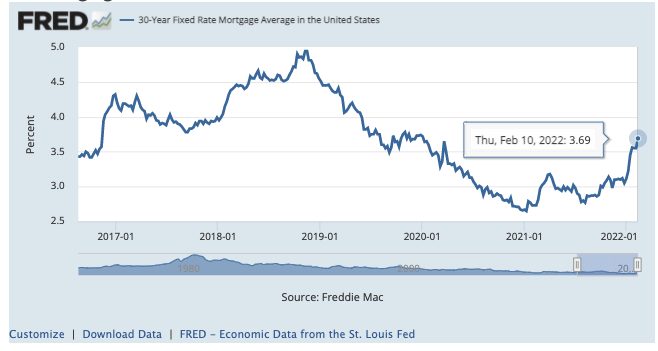
By Dennis Norman, on February 12th, 2022 Mortgage interest rates were at 3.69% for a 30-year fixed-rate loan as of this past Thursday, February 10, 2022., according to Freddie Mac’s Primary Mortgage Market Survey®. As the chart below illustrates, mortgage interest rates hit a low of 2.77% in August of 2021 and have pretty much been trending upward since.
Within the last few days, there have been a lot of reports in the media projecting mortgage interest rates to go higher this year. A lot of it is based on the current inflation rates which are not good so if the economy and rate of inflation improve, so would mortgage rates but time will tell. Personally, as of today and subject to any new major disruptions, I think rates in 2022 will stay in the mid 3% range and climb to the upper 3’s, perhaps 3.9% but could very well go over 4% if the Federal Reserve raises rates as much as is currently rumored now.
Mortgage Interest Rates – 30 Year Conventional Loan
(click on chart for live, interactive chart)
By Dennis Norman, on January 23rd, 2022 Most anyone that is interested in buying or selling a home is pretty much aware of two things: there is a low inventory of homes for sale and prices have increased a fair amount as a result. That part is likely largely a result of basic economics related to supply and demand. When the demand is greater than the supply, prices will increase. In St Louis, home prices have done just that. As the chart below (exclusively available from MORE, REALTORS®) illustrates, the median price of homes sold in January 2020 was $221, 200 and in January 2021 was $245,000, an increase of 10.8%.
Interest rates are the other part of the equation with regard to the “cost” of a home…
Since the overwhelming majority of home buyers that purchase a typical home in St Louis do so utilizing a mortgage or home loan, the interest rate on that home loan has a direct impact on what that home “costs” the homeowner in terms of the monthly payment. When buyers get pre-approved for a home loan, as well as consider how much they can afford to or want to, spend on a home, it all pretty much usually starts with the house payment. Therefore, we can’t underestimate the impact interest rates can have on home prices.
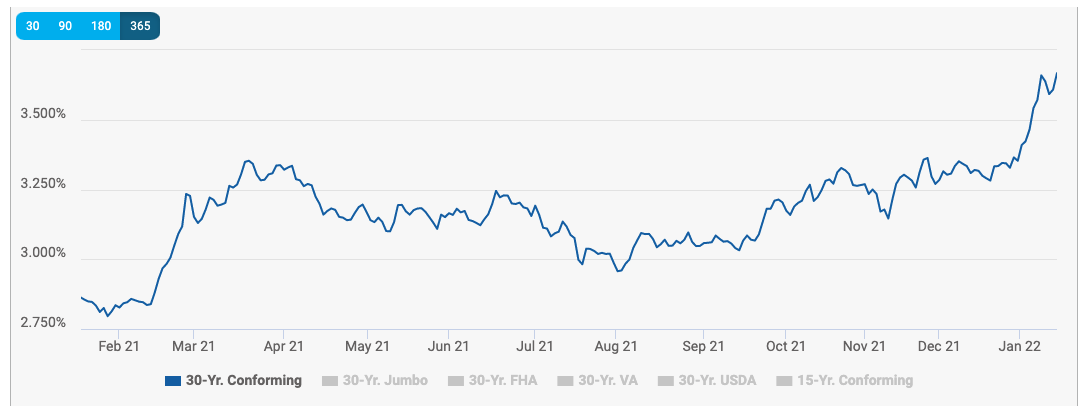
As the mortgage interest rate chart below shows, the average interest rate on a 30-year conforming conventional home loan in January 2021 was 2.811% and today has increased to 3.744%.
The change in the “cost” of a typical St Louis home in the past year…
So, if we look at the increase in the price of a typical St Louis home and then factor in the increase in the interest rates we find that the actual “cost” of a typical St Louis home (in terms of house payment) increased 25% n the past year. To keep things simple, I based this on a loan amount of 90% of the purchase price so the cost will vary depending upon downpayment of course and I’m only computing principal and interest so I’m not including escrows for property taxes or homeowners insurance.
- Typical payment on a typical St Louis home January 2021 – $ 805.00
- Typical payment on a typical St Louis home January 2022 – $ 1,009.00
Is it too late to buy since the cost has increased so much?
Continue reading “Typical St Louis Home Price Increased Nearly 11 Percent In Past Year – Payment On The Home Increased 25%“
By Dennis Norman, on January 17th, 2022 Today, thanks to many apps and access to information, all consumers have ready and easy access to their FICO (credit) score. Anyone thinking of buying a home no doubt knows their credit score will come into play in terms of qualifying for a mortgage but just how significant is your credit score? Is there really that much difference between a 670 and 700 credit score, or between a 700 and 741 score? Well, when it comes to mortgage rates, it does make a difference!
A 670 FICO vs a 741 FICO will run up the typical cost of St Louis home over $17,000 over the life of your loan!
For example, as the table below illustrates, the median interest rate for a mortgage for a person in St Louis (borrowing over 80% of purchase price) with a FICO score of less than 680 is 3.962% versus an interest rate of 3.611% for someone with a FICO score above 740. The median price of homes sold in St Louis during the past 30 days was $245,055. So, to make it simple, if we assume that for the loan amount a person with a 679 score would be looking at a house payment of $1,153 per month (principal and interest) while someone with a 741 credit score would be looking at a payment of $1,104 or $49 per month less. That may not sound like much, but over the 30-year life of the mortgage that means the person with the lower credit score will pay $17,640 more in interest than the borrower with the higher score. Or, to look at it a different way, for the same payment of $1,153 that the lower score borrower will pay for a $245,055 home, the borrower with the higher score can buy a home that costs $255,823.
[xyz-ips snippet=”Interest-Rates-and-Mike-McCarthy-Promo”]
Continue reading “How Much Of An Impact Does Your FICO Score Have On The Cost Of A Home?“
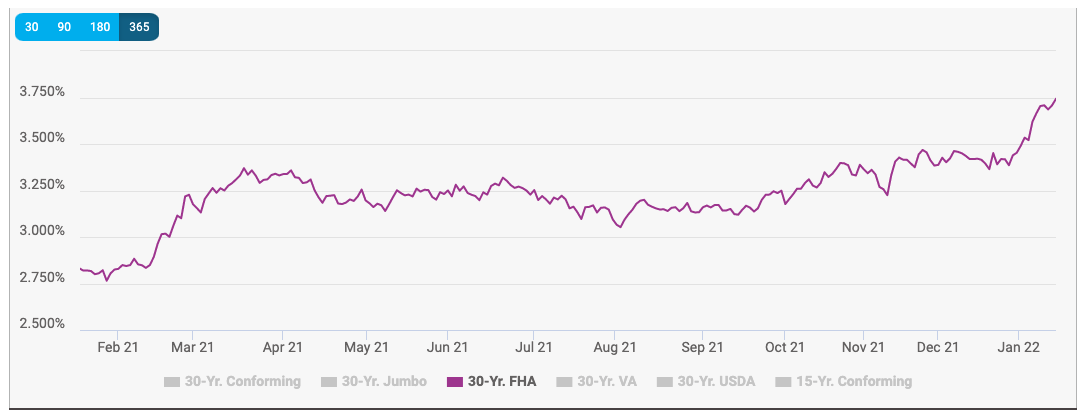
By Dennis Norman, on January 16th, 2022 Mortgage interest rates were at 3.667% for a 30-year fixed-rate loan as of this past Thursday, January 13, 2022. As the chart below illustrates, after dipping slightly the week prior, the rates this most recent week hit the highest level in over a year.
Mortgage rates for an FHA mortgage also hit the highest level in over a year too with rates hitting 3.743%.
Mortgage Interest Rates – 30 Years Conforming Conventional Loan -Past 12 Months
(click on chart for live, interactive chart and other loan types)
Mortgage Interest Rates – 30 Year FHA
(click on chart for live, interactive chart and other loan types)
By Dennis Norman, on November 24th, 2021 As the charts below illustrate, at the beginning of this year, mortgage interest rates for a 30-year conforming conventional loan were at 2.771%, FHA loans were at 2.703%, and VA loans were at 2.372%. As of yesterday, those rates have increased to 3.357%, 3.468%, and 3.101% respectively.
While conforming 30-year conventional loans have seen an increase of 21% in rates (from 2.771% to 3.357%), FHA loans have seen an increase of 28% (from 2.703% to 3.468%) and VA loans have seen an increase of 30% (from 2.372% to 3.101%).
What does this mean in terms of the cost of a home?
To make the comparison simple, I’ll just base my comparison on the price of a “typical” home in the St Louis 5-county core market using the median price of homes sold in October which was $234,900. Downpayments will vary based upon loan type from no downpayment being required on a VA loan, to a minimum of 3% on a conventional and 3.5% on an FHA but based upon a loan amount equal to the median price of $234,900, below are the differences in the monthly payment on that amount by loan type from the beginning of this year until now:
- Conventional – $948 to $1,023
- FHA – $939 to $1,038
- VA – $898 to $990
If we factor in the increase in home prices, it gets worse.
In the “to add insult to injury” category, home prices have increased significantly since January as well, In January the median price was $215,000, so between then and October the median price of a St Louis home increased 9.2%. With the interest rates increasing at the same time the cost of a typical St Louis home increased fairly significantly as shown below:
- Conventional – $867 to $1,023 (+18%)
- FHA – $859 to $1,038 (+21%)
- VA – $821 to $990 (+21%)
The moral of the story…don’t wait to buy.
While I certainly can’t predict the future, especially given all the uncertainty in our economy with inflation, employment issues, etc, if I were in the market to buy a home I don’t think I would wait “until things get better”. The reason for my opinion is, as I’ve illustrated here, the true “cost” of a home (assuming you are not paying cash for it) is a combination of price and interest rate. So, even if home prices see an adjustment or the seasonal dip we often see during winter if interest rates continue to rise, is the higher cost of borrowing going to offset the lower price? I think that is a possibility. Or, the flip side, if interest rates go down but then prices go up, is the savings in lower rates lost?
To benefit from waiting, in terms of the cost of the home, we would need interest rates to stay the same, or decline and home prices to decline or interest rates to drop and home prices stay the same. Right now I don’t see either of the two aforementioned scenarios likely to happen.
Continue reading “Mortgage Rates Have Increased Significantly This Year“
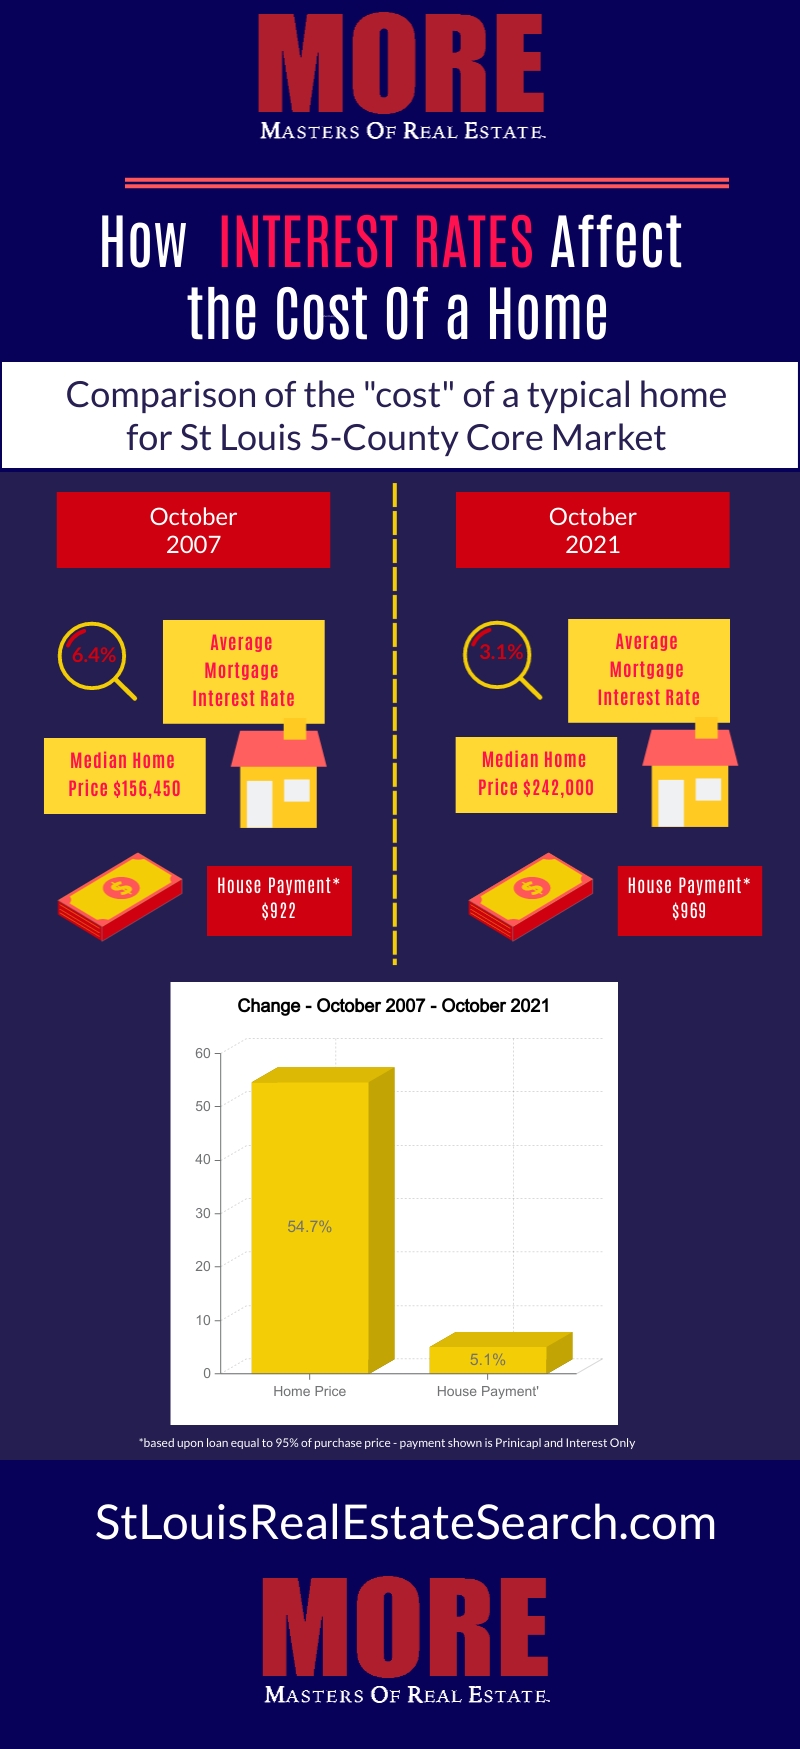
By Dennis Norman, on November 13th, 2021 Anyone paying even a little attention to the St Louis real estate market will likely be aware of the fact that we have been in a strong seller’s market for the past couple of years and St Louis home prices, as a result, have increased significantly. In fact, as the infographic below shows (exclusively available from MORE, REALTORS®) the median home price for a St Louis home has increased more than 50% in the past 14 years. However, the good news is that during that same period mortgage interest rates have fallen and remained low resulting an increase in the house payment on a typical home increase just over 5% during the same period!
[xyz-ips snippet=”Homes-For-Sale-and-Listings-With-Virtual-Tours”]
By Dennis Norman, on November 11th, 2021 Two-thirds of the homes sold in the St Louis 5-County core market (St Louis city and the counties of St Louis, St Charles, Jefferson, and Franklin) during October sold for the asking price or above. As the infographic below shows (exclusively available from MORE, REALTORS®) there were 2,888 homes sold during October in the St Louis 5-County core market with 65% of them selling at the list price or above. One thing to remember about home prices though, and something you won’t hear from too many people reporting prices, is that not all sold prices are the “real” price.
[xyz-ips snippet=”Homes-For-Sale-and-Listings-With-Virtual-Tours”]
Continue reading “Two-Thirds Of Homes Sold In St Louis Core Market In October Sold At Or Above List Price“
|
Recent Articles
|


