By Dennis Norman, on February 7th, 2023 According to data released by ATTOM Data Research, during the fourth quarter of 2022, 42.37% of the homeowners with a mortgage within the 63376 zip code, were “equity-rich” meaning their mortgage balance was just 50% or less of the current value of their home. The table below shows the 10 St Louis zip codes with the highest percentage of equity-rich mortgages. Half of zip codes on the list are located within the St Charles County, four in St Louis County and one in Jefferson County
Also shown on the table is the percentage of homeowners with a seriously-underwater mortgage, meaning their loan balance is 125% or more of the current home value.
[xyz-ips snippet=”Homes-For-Sale-and-Listings-With-Virtual-Tours”]
St Louis Seriously Equity-Rich Homeowners By Zip Code – Top 10 Highest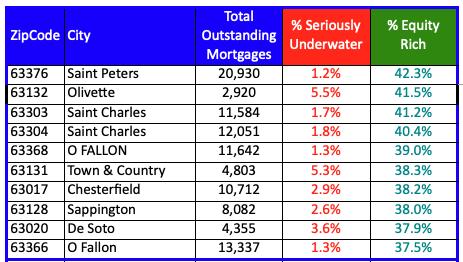
By Dennis Norman, on February 6th, 2023 According to data released by ATTOM Data Research, during the fourth quarter of 2022, 35.7% of the homeowners with a mortgage within the 63118 zip code, were seriously underwater on their mortgage, meaning their mortgage balance exceeds the value of their home by 25% or more. The table below shows the 10 St Louis zip codes with the highest percentage of seriously underwater mortgages. Half of zip codes on the list are located within the City of St Louis and the other half are located in North St Louis County.
Also shown on the table is the percentage of homeowners with an equity-rich mortgage, meaning their loan balance is 50% or less of the current home value. Six of the 10 zip codes on the list have a higher percentage of equity-rich mortgages than that of seriously underwater mortgages.
[xyz-ips snippet=”Homes-For-Sale-and-Listings-With-Virtual-Tours”]
St Louis Seriously Underwater Homeowners By Zip Code – Top 10 Highest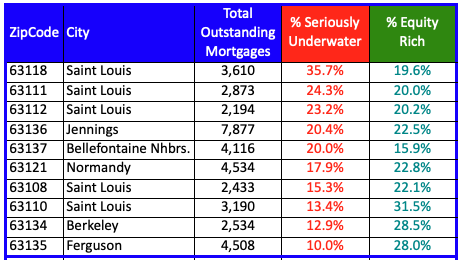
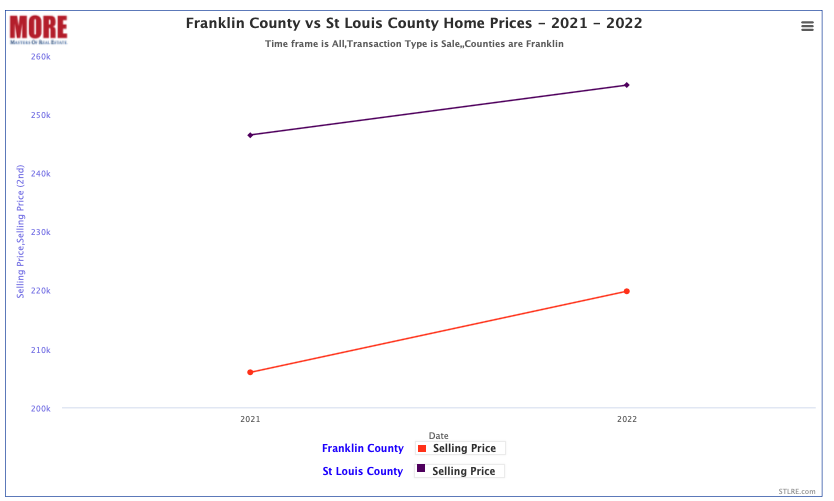
By Dennis Norman, on January 13th, 2023 The median price of homes sold in Franklin County increased from 2021 to 2022 at nearly double the rate the price of homes sold in St Louis County did during the same period. As the chart below shows, the median price of homes sold in Franklin County during 2021 was $206,000 and then increased 6.7% to $219,800 in 2022. During the same period, the median price of homes sold in St Louis County increased 3.4% from 246,500 to $255,000.
[xyz-ips snippet=”Franklin-County-For-Sale-and-Open-Houses”][xyz-ips snippet=”St-Lous-County-Homes-For-Sale”]
Franklin County vs St Louis County Home Prices – 2021-2022
(click on chart for live, interactive chart)
By Dennis Norman, on December 25th, 2022
By Dennis Norman, on December 20th, 2022 Today, the Consumer Financial Protection Bureau (CFPB) released details of a Consent Order they reached with Wells Fargo Bank, N.A. in which Wells Fargo is ordered to pay “more than $2 billion in redress to consumers and a $1.7 billion civil penalty for legal violations across several of its largest product lines.” According to a press release issued by the CFPB, Wells Fargo’s “..illegal conduct led to billions of dollars in financial harm to its customers and, for thousands of customers, the loss of their vehicles and homes.” Rohit Chopra, the Director of the Consumer Financial Protection Bureau, stated “Wells Fargo’s rinse-repeat cycle of violating the law has harmed millions of American families”.
The CFPB order requires Wells Fargo to:
- Provide more than $2 billion in redress to consumers: Wells Fargo will be required to pay redress totaling more than $2 billion to harmed customers. These payments represent refunds of wrongful fees and other charges and compensation for a variety of harms such as frozen bank accounts, illegally repossessed vehicles, and wrongfully foreclosed homes. Specifically, Wells Fargo will have to pay:
- More than $1.3 billion in consumer redress for affected auto lending accounts.
- More than $500 million in consumer redress for affected deposit accounts, including $205 million for illegal surprise overdraft fees.
- Nearly $200 million in consumer redress for affected mortgage servicing accounts.
- Stop charging surprise overdraft fees: Wells Fargo may not charge overdraft fees for deposit accounts when the consumer had available funds at the time of a purchase or other debit transaction, but then subsequently had a negative balance once the transaction settled. Surprise overdraft fees have been a recurring issue for consumers who can neither reasonably anticipate nor take steps to avoid them.
- Ensure auto loan borrowers receive refunds for certain add-on fees: Wells Fargo must ensure that the unused portion of GAP contracts, a type of debt cancellation contract that covers the remaining amount of the borrower’s auto loan in the case of a major accident or theft, is refunded to the borrower when a loan is paid off or otherwise terminates early.
- Pay $1.7 billion in penalties: Wells Fargo will pay a $1.7 billion penalty to the CFPB, which will be deposited into the CFPB’s victims relief fund.
To get more information on the CFPB victims relief fund, click here.
Wells Fargo employees who are aware of other illegal activity are encouraged to send information about what they know to whistleblower@cfpb.gov.
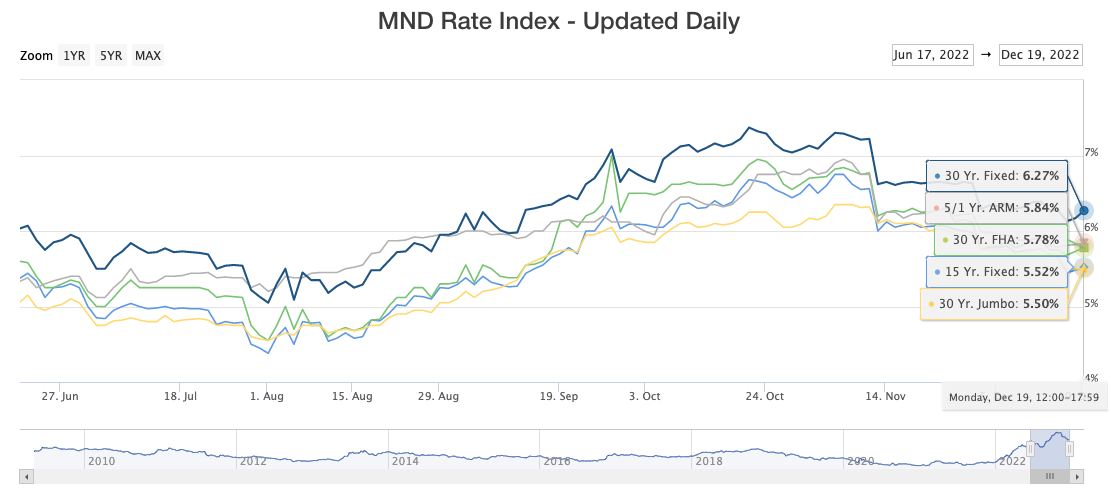
By Dennis Norman, on December 20th, 2022 As the chart below illustrates, yesterday, mortgage interest rates on a 30-year fixed rate conventional mortgage increased slightly to 6.27% after dropping to 6.13% last Thursday, the lowest level in over 3 months.
Historically-speaking, it’s not that bad….
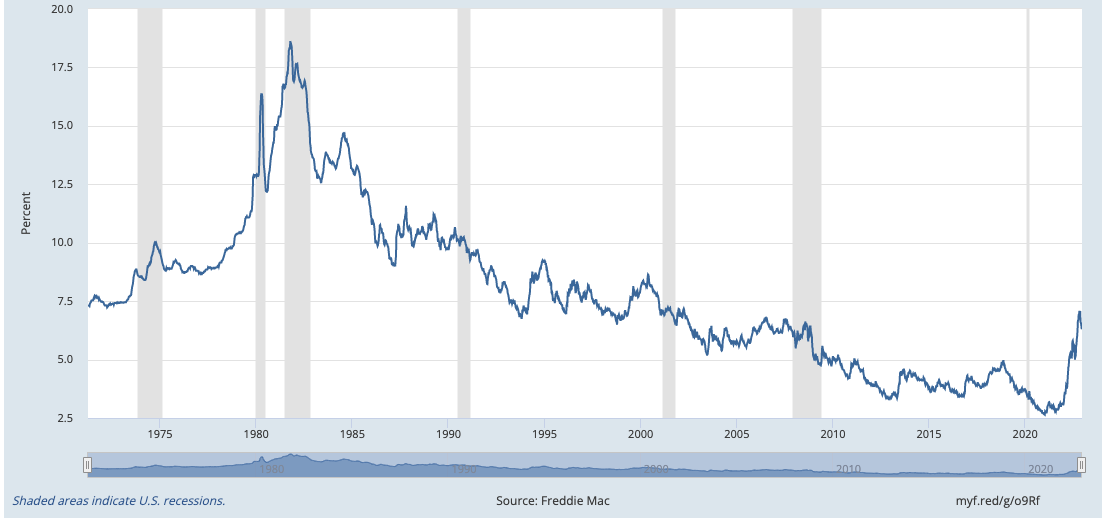
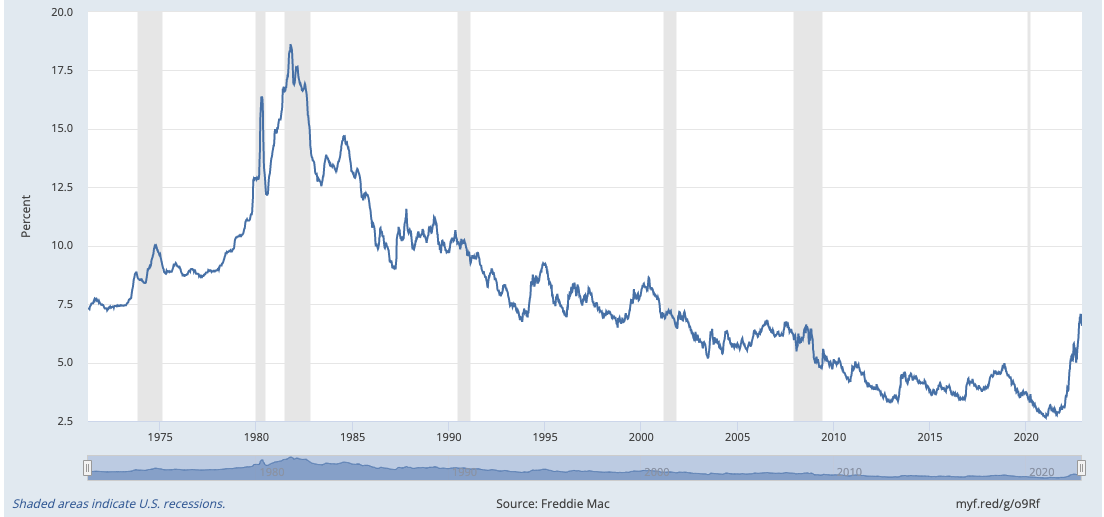
Granted, no one really wants to hear this, but, if we look at the bigger picture (like the bottom chart that goes back to 1971) we’ll see that our current mortgage interest rates aren’t that high. In fact, over the 52-year period depicted on the chart, about 70% of the time mortgage interest rates were higher than they are now. If you’re in your 20’s or 30’s you likely don’t care and still think the rates suck since they are about double what they have been since you have paid attention to them. If you’re a baby-boomer like me, it’s a walk down memory lane LOL.
Mortgage Interest Rates Based Upon the MND Rate Index
(click on chart for live, interactive chart)
30-Year Fixed Rate Mortgage Interest Rates 1971-Present
(click on chart for live, interactive chart)
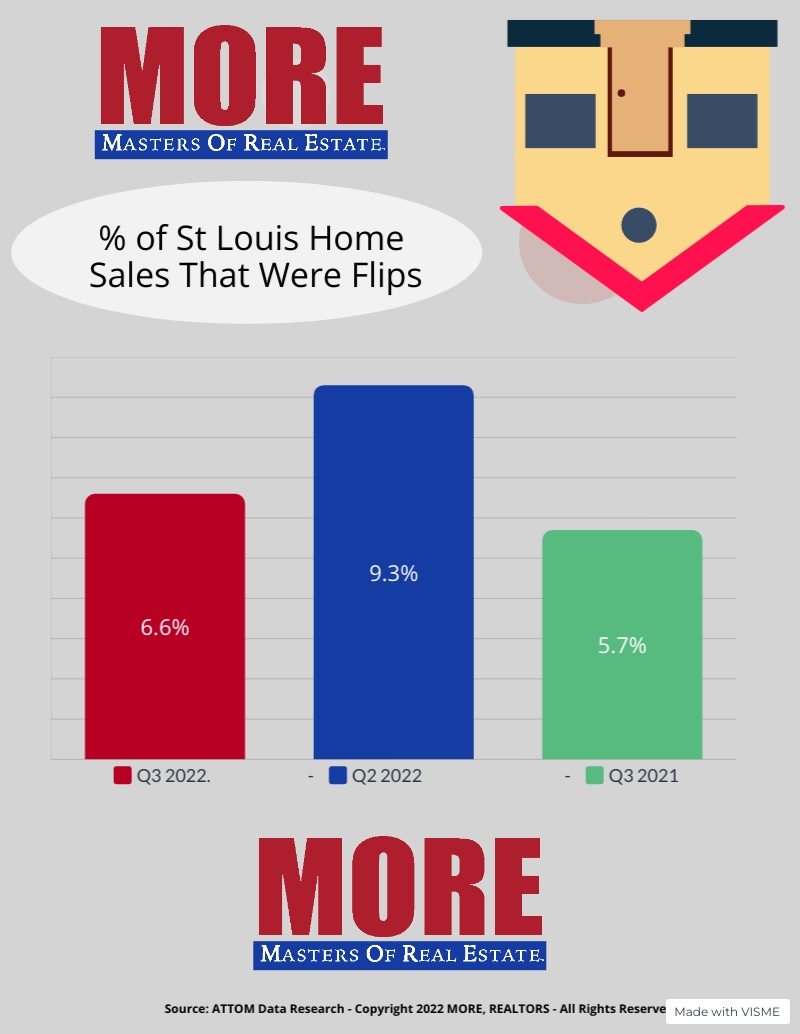
By Dennis Norman, on December 15th, 2022 There were 900 homes and condominiums “flipped” during the third quarter in the St Louis M.S.A., according to data just released by ATTOM Data Solutions. As the chart below illustrates, these flips represent 6.6% of all sales during the 3rd quarter of 2022, a decrease of 28.8% from the prior quarter but an increase of over 15% from a year ago.
[xyz-ips snippet=”Foreclosures-For-Sale-and-Homes-For-Sale”]
St Louis Home Flipping Trends
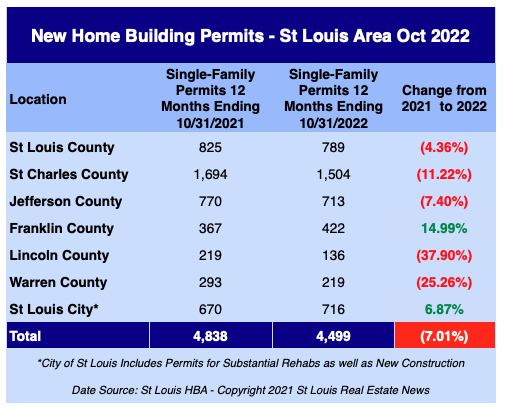
By Dennis Norman, on December 9th, 2022 There were 4,499 building permits issued for new single-family homes in the St Louis area during the 12-month period ended October 31, 2022, a decrease of 7.01% from the same period a year ago when there were 4,838 permits issued, according to the latest data from the Home Builders Association of St. Louis & Eastern Missouri (St Louis HBA). Five of the seven counties covered in the report saw a decrease in building permits from the same period a year ago with three of the counties have a double digit decline. Franklin County came out the big winner with nearly a 15% increase in building permits issued during the past 12-months.
St Louis New Home Building Permits – October 2022
By Dennis Norman, on December 2nd, 2022 This week the Federal Housing Finance Administration (FHFA) announced that the limits for all conforming home loans to be acquired by Fannie Mae and Freddie-Mac (most of the conventional home loans originated) will increase to $726,200 on January 1, 2023. This is an increase of $79,000 for the current loan limit of $647,200.
Also this week, the Federal Housing Administration (FHA) announced that the limits for all FHA loans will increase to between $472,030 and $1,089,300 for single-family homes depending on the area the property is located in. Below are the limits for the low cost mortgage areas as well as high-cost mortgage areas:
Low Cost Area: (The entire state of Missouri falls into this category)
-
- One-unit: $472,030
- Two-unit: $604,400
- Three-unit $730,525
- Four-unit: $907,900
High Cost Area:
-
- One-unit: $1,089,300
- Two-unit: $1,394,775
- Three-unit 1,685,850
- Four-unit: $2,095,200
The Veteran’s Administration, as of 2020, removed the lending limit for veteran’s with full entitlement so there remains no limit on VA loans.
[xyz-ips snippet=”Traci-Everman—FHA-VA-Loan-Specialist”]
By Dennis Norman, on December 1st, 2022 According to results just released by Lending Tree from a survey they conducted in October, 41% of American’s surveyed expect the housing market to crash next year. As the table below, which shows the results by generation, the Millennials are the most pessimistic about the market with 44% of the millennials surveyed believing the housing market is headed to a crash. The most optimistic generation? Baby boomers, with only 35% of the generation I belong to believing we are headed to a crash.
Inflation is the leading culprit…
Of those surveyed that believe the housing market is headed for a crash in the next year, 33% felt inflation would be the leading cause of the crash, followed by 24% that said it was interest rates.
Continue reading “Forty-One Percent of Americans Think The Housing Market Will Crash Next Year“
By Dennis Norman, on November 25th, 2022 As the chart below illustrates, on November 10th, mortgage interest rates on a 30-year fixed rate mortgage dropped sharply from 7.22% the day before to 6.62% on the 10th. Since dropping, interest rates have remained around the 6.6% level.
Historically, the current rates are not bad, but that does lessen the impact…
As the bottom chart below shows, interest rates have been above the current levels for over half the period. However, understandably, that doesn’t mean much to first-time home buyers or younger homebuyers as for over the past 10 years the rates have been much less, even to the point of hitting all-time lows in the mid 2’s.
Mortgage Interest Rates Based Upon the MND Rate Index
(click on chart for live, interactive chart)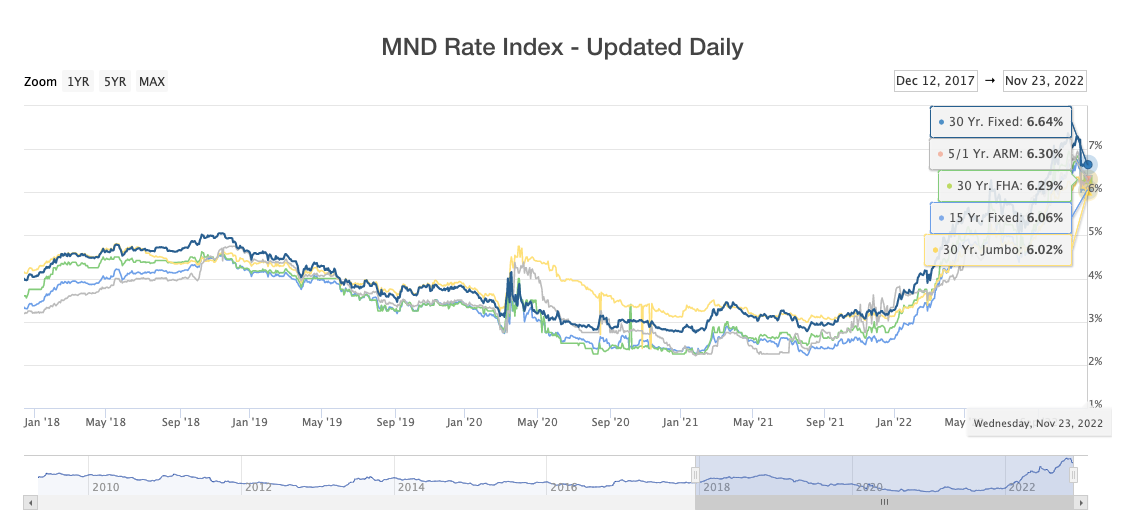
30-Year Fixed Rate Mortgage Interest Rates 1970-Present
(click on chart for live, interactive chart)
By Dennis Norman, on November 23rd, 2022 Is the St Louis real estate market going to crash? The national news is filled lately with reports of slowing housing markets throughout the country, increasing inventories, falling sales and prices. Some prognosticators are predicting some metro areas will see home prices fall by as much as 40 or 50 percent. Is the St Louis real estate market on a similar trajectory?? While I can’t predict the future, I can share data to help you see where the St Louis real estate market is currently as well as where the data shows it’s headed.
[xyz-ips snippet=”Market-Update-Video–Media-Center”]

[xyz-ips snippet=”Seller-Resources—Listing-Targeted”]
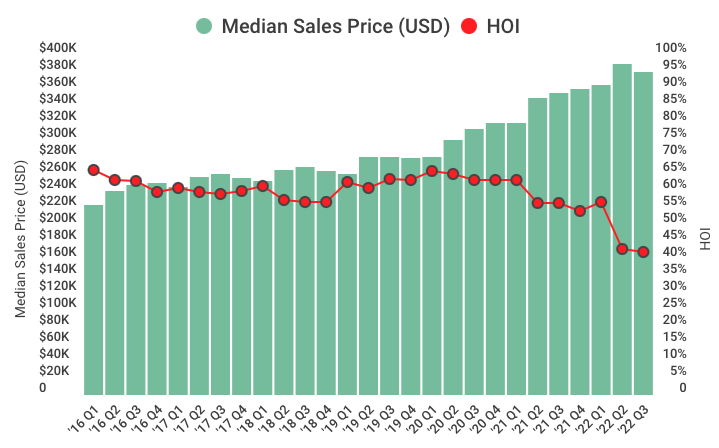
By Dennis Norman, on November 9th, 2022 The National Association of Home Builders (NAHB) and Wells Fargo, jointly publish quarterly their Housing Opportunity Index (HOI) which shows the affordability, or lack thereof, of homes to a typical family. To arrive at an index value the median home price of recently sold homes for an area is taken into account as well as the median income for a family in that area. From this data the index is computed to show how affordable the typical home is to a typical family. The higher the index, the more affordable homes are to buyers in that market and the lower the index the less affordable.
For the 3rd quarter of 2022, the HOI index hit the lowest level (meaning homes were less affordable) since the inception of the HOI in 2012. As the chart below shows, the current Housing Opportunity Index for the U.S. is at 42.2% meaning just over 40% of families can afford to buy a home in their area. This is down slightly from 2nd quarter but down quite a bit from the first quarter of this year when it was 56.9%.
Affordability in St Louis is much better…
The NAHB/Wells Fargo Housing Opportunity Index is also produced for metro-areas. For the third quarter of this year, St Louis had a HOI index of 74.8, over 30 points better than the national index! This means a typical home in St Louis is affordable to about 30% more of St Louis families with a typical income than on the national level.
NAHB/Wells Fargo Housing Opportunity Index (HOI)
(click on chart for current, live, interactive chart)
By Dennis Norman, on October 28th, 2022 As the tables below show, so far during October there have been 52 home sales closed in Franklin County, down 43% from the same period last year when there were 91 sales closed. The median sold price this month for those closed sales in Franklin County has been $210,000 an increase of over 12 percent from the same period last year when the median prices homes in Franklin County sold for was $187,000.
The time it took listings to sell actually improved slightly with the median time being 43 days last October and 4o days this month. Last year the homes sold for a median of 100% of the asking price and this month it dropped slightly to 99.68%.
Franklin County Closed Home Sales Oct 1, 2021 – Oct 24, 2021
(click on table for all current data)
Franklin County Closed Home Sales Oct 1, 2022 – Oct 24, 2022
(click on table for all current data)
By Dennis Norman, on October 28th, 2022 As the tables below show, so far during October there have been 704 home sales closed in St Louis County, down 26% from the same period last year when there were 955 sales closed. The median sold price this month for those closed sales in St Louis County has been $255,000 an increase of over 10 percent from the same period last year when the median prices homes in St Louis County sold for was $231,000. The time it took listings to sell has not changed with both periods having a median of 12 days and homes sold for a median of 100% of the asking price during both periods as well.
St Louis County Closed Home Sales Oct 1, 2021 – Oct 24, 2021
(click on table for all current data)
St Louis County Closed Home Sales Oct 1, 2022 – Oct 24, 2022
(click on table for all current data)

By Dennis Norman, on October 27th, 2022 As the tables below show, so far during October there have been 278 home sales closed in St Charles County, down 28% from the same period last year when there were 388 sales closed. The median sold price this month for those closed sales in St Charles County has been $337,000 an increase of over 12 percent from the same period last year when the median prices homes in St Charles County sold for was 300. Another bit of data which is illustrates the overbidding we’ve seen in the past that has quickly come to an end for the most part is that a year ago the St Charles County homes were selling for 102.32% of the listing price at the time of sale and for the closings this month it’s been 100% of the list price. Granted, getting full price is a good thing it’s just seller’s were enjoying the bonus of overbids they were receiving before.
[xyz-ips snippet=”St-Charles-County-For-Sale-and-Open-Houses”]
St Charles County Closed Home Sales Oct 1, 2021 – Oct 24, 2021
(click on table for all current data)

St Charles County Closed Home Sales Oct 1, 2022 – Oct 24, 2022
(click on table for all current data)

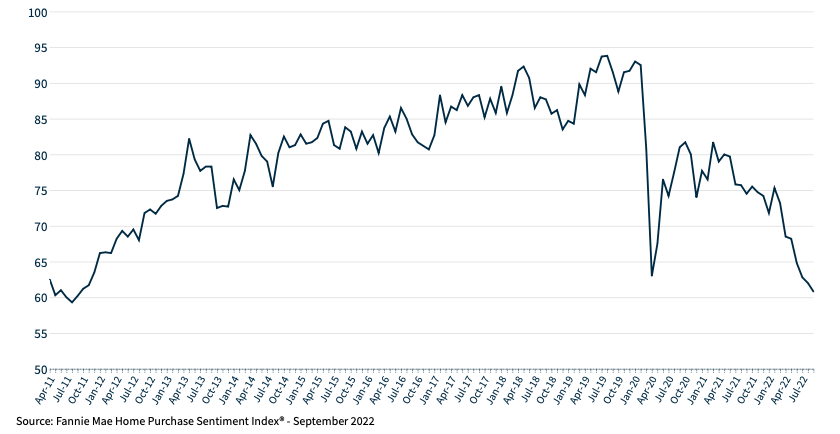
By Dennis Norman, on October 27th, 2022 Monthly, Fannie Mae surveys consumers to gauge their sentiment toward whether it’s a good time to buy or sell a home and publishes the result in their Home Purchase Sentiment Index® (HPSI). As the chart below illustrates, in the most recent survey, which was just released, the HPSI index was at 60.8, the lowest level in nearly 11 years. No doubt the higher interest rates and softening economy are taking their toll on homebuyer’s optimism about the prospects of buying a home in the current market. This marks the seventh-consecutive monthly decline in the index and the first time since May 2020 that more consumers thought home prices would decline than not. In September 2022, the month covered in the latest report, only 19% of consumers thought it was a good time to buy a home while 59% felt it was a good time to sell.
You can access all the data and charts from the Fannie Mae Purchase Sentiment report here.
[xyz-ips snippet=”Homes-For-Sale”]
Fannie Mae Home Purchase Sentiment Index Chart
(click on chart for live, interactive chart)
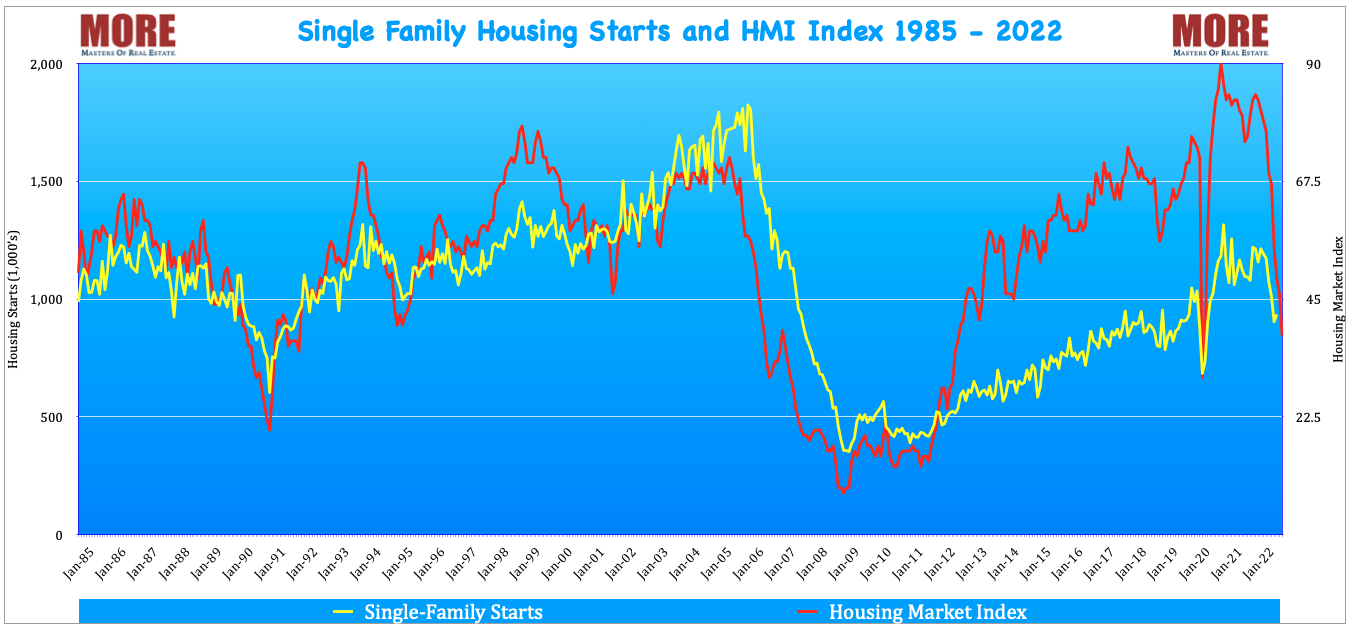
By Dennis Norman, on October 18th, 2022 The National Association of Home Builders (NAHB) released their NAHB/Wells Fargo Housing Market Index (HMI) report for October 2022 and, not surprisingly, it shows the builders are continuing to lose confidence in the market. As our chart below shows, the Housing Market Index (HMI), the red line, peaked in November 2020 at 90 and has, with the exception of a few minor upticks along the way, fallen ever since reaching 38, the lowest level since August 2012 when it fell to 37.
Single Family Housing Starts and HMI Index 1985-2022 (NAHB)
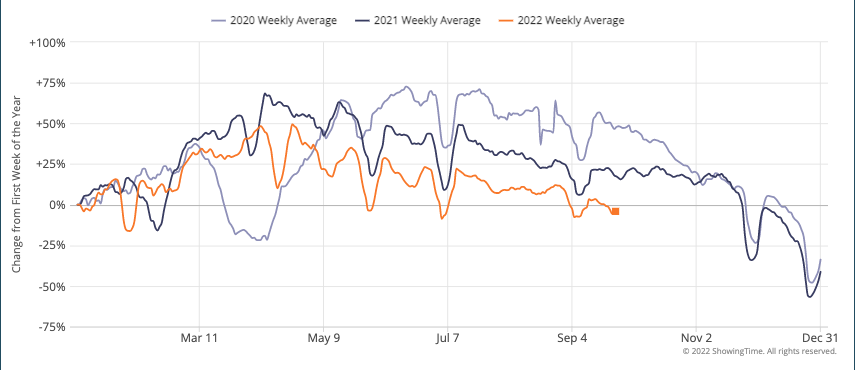
By Dennis Norman, on September 26th, 2022 It’s no secret that the real estate market slows down in the winter and typically nearly screeches to a halt from shortly before Christmas to shortly after New Years. Therefore, when tracking showing activity in the St Louis area, the first week of January of each year is used as the base, or “0” value and then each rolling 7-day period afterward is compared to that first week.
As the chart below shows, in 2020 and 2021 all weekly averages of showing activity were above the baseline of January until getting close to Thanksgiving, with the one exception being late March and Early April of 2020 which was a result of the COVID-19 pandemic beginning. The orange line depicts this year and it shows showing activity all year has been below the levels of the prior two years for the most part, even dropping below January levels five times so far this year and has spent the bulk of September below the January levels. For the most recent 7 day period, ended September 25th, there were over 4% fewer showings in the St Louis area than during the first week of January this year.
Listing Showing Activity For the St Louis Metro Area (along with other markets served by MARIS)
(click on chart for live, interactive chart)
By Dennis Norman, on September 15th, 2022 On Monday of this week, a federal lawsuit was filed in the United Status District Court for the Western District of Washington by Natalie Perkins and Kenneth Hasson against Zillow Group, Inc. and Microsoft Corporation. The suit was filed as a class action complaint on behalf of “All natural persons in the United States and its territories whose Website Communications were captured through the use of Session Replay Code embedded in Zillow’s website”.
In the complaint, the plaintiff’s allege that the defendants, Zillow and Microsoft, violated the Washington Wiretapping Statute (Wash. Rev. Code §9.73.030, et. seq.) through the use of Microsoft’s Session Replay Code “…on Zillow’s website to spy on, automatically and secretly, and to intercept Zillow’s website visitors’ electronic interactions communications with Zillow in real time”. The second Count of the complaint, Invasion of Privacy – Intrusion Upon Seclusion, alleges that, using the same code as well as other methods which violated the plaintiff’s “…reasonable expectation of privacy in their Website Communications..” which violates the plaintiff’s “….right to
privacy is also established in the Constitution of the State of Washington which explicitly recognizes an individual’s right to privacy under Article 1 §7.”
The lawsuit is asking the court for relief in the form of a judgment as follows:
A. Certifying the Class and appointing Plaintiffs as the Class representatives; B. Appointing Plaintiffs’ counsel as class counsel;
C. Declaring that Defendants’ past conduct was unlawful, as alleged herein; D. Declaring Defendants’ ongoing conduct is unlawful, as alleged herein;
E. Enjoining Defendants from continuing the unlawful practices described herein, and awarding such injunctive and other equitable relief as the Court deems just and proper;
F. Awarding Plaintiffs and the Class members statutory, actual, compensatory, consequential, punitive, and nominal damages, as well as restitution and/or disgorgement of profits unlawfully obtained;
G. Awarding Plaintiffs and the Class members pre-judgment and post-judgment interest;
H. Awarding Plaintiffs and the Class members reasonable attorneys’ fees, costs, and expenses; and
I. Granting such other relief as the Court deems just and proper.
The entire lawsuit filing, NATALIE PERKINS and KENNETH HASSON, individually and on behalf themselves and of all others similarly situated, Plaintiffs, v. ZILLOW GROUP, INC. and MICROSOFT CORPORATION, can be accessed here.
By Dennis Norman, on August 12th, 2022  Apparently a lot of consumers are concerned about the housing market crashing or at least concerned enough to be online searching for answers. According to Google Trends the search phrase “Will The Housing Market Crash?” has hit it’s 5-year peak in terms of interest level during the last 4-5 months. In addition, according to Google Adwords tools, there are 10,000 – 100,000 searches for month for the phrase “Will The Housing Market Crash?” and 100,000 – 1,000, 000 monthly searches for “housing market crash“. Apparently a lot of consumers are concerned about the housing market crashing or at least concerned enough to be online searching for answers. According to Google Trends the search phrase “Will The Housing Market Crash?” has hit it’s 5-year peak in terms of interest level during the last 4-5 months. In addition, according to Google Adwords tools, there are 10,000 – 100,000 searches for month for the phrase “Will The Housing Market Crash?” and 100,000 – 1,000, 000 monthly searches for “housing market crash“.
Will there actually be a housing market crash in St Louis?
I guess first we should define “crash” as the word itself sounds rather harsh. But if we agree that a market crash would be less severe than the housing market bubble burst we witnessed in 2008, then I would say a “crash” is more likely than a bubble burst. However, what may seem like a crash in the St Louis housing market may in fact not be as much of a crash as well as a correction. Given that the St Louis real estate market has been flying high for a few years now and many seller’s have felt like they died and went to heaven and buyer’s just felt like they died from the competition and difficulty in buying a home, a correction is really needed.
How bad will the St Louis housing market correction be?
Continue reading “Will The Housing Market Crash?“
By Dennis Norman, on August 5th, 2022 I saw dozens and dozens of headlines yesterday reporting that mortgage interest rates had fallen below 5% on a 30-year fixed rate mortgage. The catch is on the day that was reported, yesterday, interest rates were actually above 5% on a 30-year fixed-rate loan. As our chart below shows, the MND Rate index was reporting 5.09% and, below that, Optimalblue was reporting 5.326%. Both of the aforementioned charts are updated daily and considered by many in the industry to have the most current and accurate information.
How could all the big headlines be wrong?
Well, actually the articles I scanned were not wrong in what they were reporting, the headline would just give many home buyers a different impression perhaps than what was actually being reported. What prompted the headlines was yesterday, like every week on Thursday, the Freddie Mac Primary Mortgage Market Survey® (PMMS®) results were released. In Freddie Mac’s report, it showed the average 30-year fixed rate mortgage was 4.99% (see the Freddie Mac chart at bottom). The catch is, the survey is done from Monday through Wednesday of the week and then the results reported on Thursday. Many lenders submit their rates to Freddie Mac on Monday meaning by the time the report comes out they are 3-days old. A lot happens in the mortgage market in 3-days, in fact a lot can happen during one day. Oh yeah, the other thing worth noting is if you read the details on the Freddie Mac survey the stated rate was only obtained by paying 0.80 in points, so 8/10 of 1% of the loan amount would be paid up front to get that rate.
Freddie Mac’s Survey Is Very Valuable and Relevant
[xyz-ips snippet=”Interest-Rates-and-Mike-McCarthy-Promo”]
Continue reading “Yesterday’s Headlines Say Interest Rates Are Below 5 Percent – Why They Were Wrong“
By Sandie Hea, on August 3rd, 2022 Maybe you’ve received an unsolicited offer recently to buy your home via email or postcard from Opendoor, a home buying firm. OpenDoor will make an offer on your house, bypassing the traditional method of selling your home via a REALTOR® using the MLS (which reaches 13,000+ REALTORS®) and entices you with catchy phrases on their website like “Get an instant offer and get paid” and “Skip showings and repairs”. It can sound good and SIMPLE but, according to the FTC complaint against OPENDOOR LABS, Inc. (Opendoor) and the agreement and consent order, “…consumers who sold to Opendoor have lost money compared to what they would have received through a traditional sale.”
The consent order which, according to a press release issued by Opendoor about the FTC complaint, they have agreed to, prohibits Opendoor from misrepresenting:
[xyz-ips snippet=”Sande-Hea—Seller-Resources-Listing-Targeted”]
Continue reading “Most Consumers Who Sold to Opendoor Lost Money According to FTC Complaint“
By Dennis Norman, on July 22nd, 2022 Interest rates on a 30-year fixed-rate mortgage peaked at 6.28% a little over a month ago on June 14th, sending shockwaves through the St Louis housing market. After peaking however the rates have subsided, today dropping to 5.5%, the lowest rate since July 5th. This decline brings the mortgage rates down to the range they were I for most of May this year.
Mortgage Interest Rates
(click on chart for live, interactive chart)

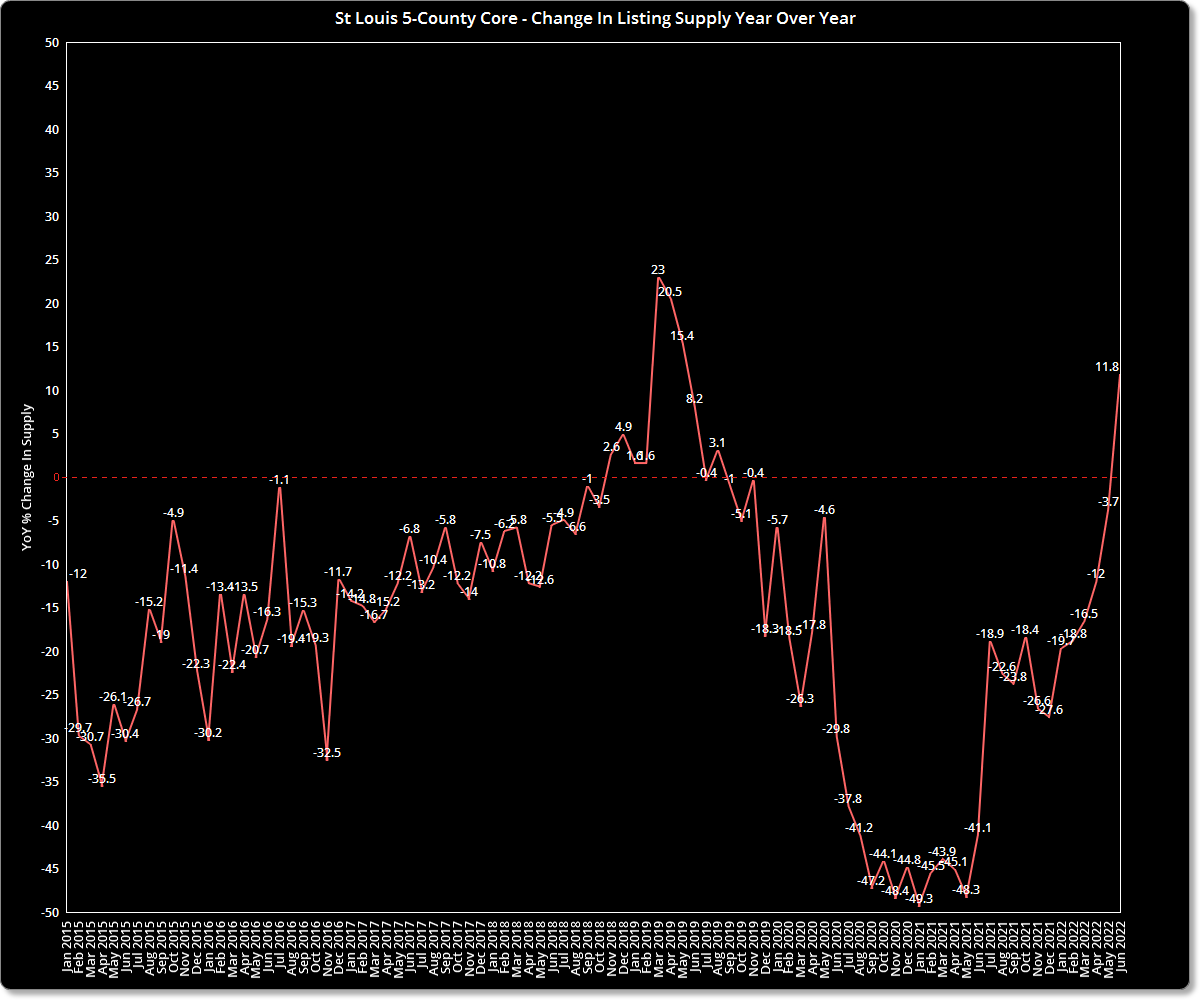
By Dennis Norman, on July 21st, 2022 The inventory of homes for sale in the St Louis core market area increased to a 1.04 month supply in June 2022, an increase of nearly 12 percent (11.8%) from a year ago when there was a 0.93 month supply. As our chart below illustrates, this is the first time since August 2019 there has been a year-over-year increase in inventory and then the increase was just 3.1%. While a double-digit increase is significant, we do need to keep in mind that, at just over a one-month supply of listings for sale is still crazy low! The median listing supply in St Louis was 3.5 months in 2015, 2.9 in 2016, 2.5 in 2017, 2.4 in 2018, 2.6 in 2019 then dropped to 1.5 months in 2020 and down to a record low 1.2 months in 2021. So, even after this double-digit increase we are still at a level this even low by last year’s record low standards.
St Louis 5-County Core – Year Over Year Percentage Change In Listing Supply
By Dennis Norman, on July 15th, 2022 If you’re heard it once, you’ve likely heard it a hundred times, “all real estate is local”. This is why you can’t put too much faith in national news or data if you are interested in buying or selling a home in St Louis. This is also why at MORE, REALTORS®, we put so much time, effort and money into producing the best and most accurate local data we can. We think it’s important to bring the data and information down to the local level.
“Homebuyers are canceling deals at highest rate since start of COVID” was the headline earlier this week on Inman News, an online real estate industry publication read by many brokers and agents. My usual response to news like this is “I wonder if that’s true in St Louis?” and I set out to pull the data to see.
There is not really a way to count “canceled” deals…
While I don’t know exactly what the writer of the Inman article was referencing in terms of “canceled” deals. However, in a typical contract to purchase a home in St Louis only gives the purchase one way to “cancel” a contract and that is in the building inspection contingency where the purchaser has the right to terminate the contract for no reason. When that happens it is not reported to the REALTOR® Multiple Listing Service (MLS) as a “canceled” listing however, it is simply put back on the market. There are certainly other reasons contracts fail and listings come back on the market such as the buyer’s inability to get financing, appraisal issues, etc.
“Back on the market” is something we can count…
Continue reading “National Headlines Say Homebuyers Canceling Deals At Highest Rate Since Start of Covid…Is this true in St Louis?“
By Dennis Norman, on July 12th, 2022 St Louis Real Estate Report for June 2022
(click on infographic for complete report including other counties)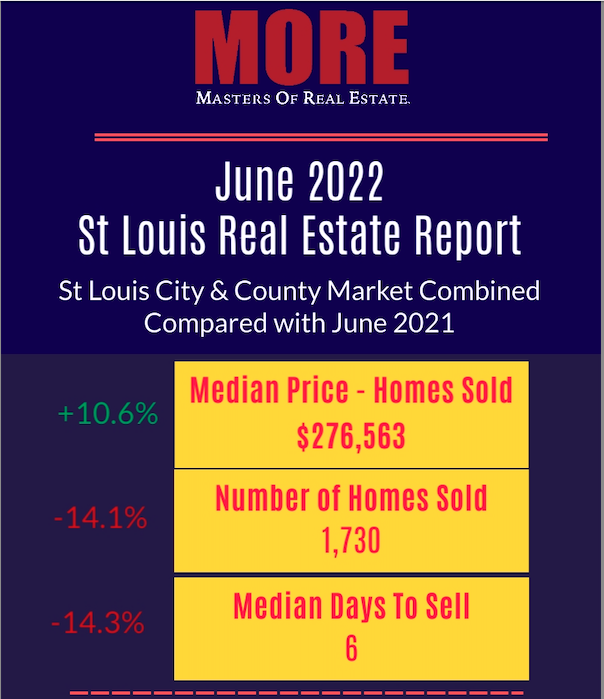
By Dennis Norman, on July 6th, 2022 It’s no secret that the real estate market slows down in the winter and typically nearly screeches to a halt from shortly before Christmas to shortly after New Years. Therefore, when tracking showing activity in the St Louis area, the first week of January of each year is used as the base, or “0” value and then each rolling 7-day period afterward is compared to that first week.
As the chart below shows, in 2020 and 2021 all weekly averages of showing activity were above the baseline of January until getting close to Thanksgiving, with the one exception being late March and Early April of 2020 which was a result of the COVID-19 pandemic beginning. The orange line depicts this year and it shows showing activity all year has been below the levels of the prior two years for the most part, however, the gap has widened in the past couple of weeks. On July 4th, for the prior 7-day period the number of showings was less than the first week of January and it dipped further on July 5th to 6.9% fewer showings during that 7-day period than the first week of January. Granted, it is always going to dip around a holiday but last year for the period ended July 5th there were 9.1% more showings than the first week of January, for a difference of 16% from this year.
Rising interest rates and increased inflation are no doubt two of the big reasons for this along with a low inventory of homes for sale.
Continue reading “Showings Of St Louis Listings Fall To Levels Below January“
By Dennis Norman, on June 23rd, 2022 After hitting the highest rate in over 13 years just two weeks ago at 6.28%, as the chart below shows, mortgage interest rates on 30-year fixed mortgages declined today to 5.75%. The likelihood of interest staying under 6% is hard to to say at this time but I would say enjoy it while it lasts!
Mortgage Interest Rates – 30 and 15-Year Conventional Loans, FHA Jumbo and and 5/1 ARM Loans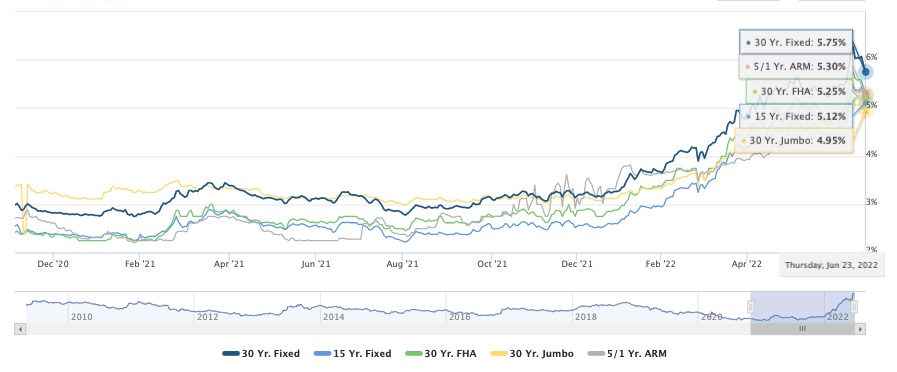
By Dennis Norman, on June 15th, 2022 After over 40 years in the real estate business in St Louis I’ve seen many times just how fast a good, or even great housing market can turn sour as well as the other way around. Two years ago, economic conditions relevant to the housing market included:
Today, the above conditions are:
Does this mean St Louis home prices will come crashing down?
First off, I’m not an economist, in fact I didn’t even attend college and I certainly don’t have a crystal ball showing me the future, but I am a data junkie that has lived through a variety of markets spanning more than 4 decades. My experience as well as my study of past markets as well as current indicators of things to come certainly give me an opinion. In times past, my opinions on the market have been spot on, almost to the point that I even surprised myself (such as in October 2006, at the peak of the housing boom when I predicted the collapse) and other times I’ve been wrong, sometimes way wrong. The reality is that the housing market is affected, or can be affected by so many different economic factors, as well as social issues, consumer sentiment and more that I don’t believe anyone can predict what it’s going to do accurately consistently.
Continue reading “Will Home Prices Come Crashing Down?“
|
Recent Articles
|


 Apparently a lot of consumers are concerned about the housing market crashing or at least concerned enough to be online searching for answers. According to Google Trends the search phrase “Will The Housing Market Crash?” has hit it’s 5-year peak in terms of interest level during the last 4-5 months. In addition, according to Google Adwords tools, there are 10,000 – 100,000 searches for month for the phrase “Will The Housing Market Crash?” and 100,000 – 1,000, 000 monthly searches for “housing market crash“.


