By Dennis Norman, on February 21st, 2026 
The St. Louis City real estate market has experienced notable shifts as of February 2026. Homes sold for a median price of $200,500 in January 2026, marking a 7.79% decrease from January 2025’s median of $217,450. This price also reflects a 14.68% decline from December 2025, when the median price was $235,000. The median list price in January 2026 stood at $199,700, down 15.02% from $235,000 a year earlier.
In terms of sales volume, there were 154 home sales in January 2026, representing an 8.33% decrease from the 168 homes sold in January 2025. These statistics, along with other key Continue Reading →
By Dennis Norman, on January 21st, 2026
The St. Louis City real estate market experienced notable shifts in December 2025. Homes sold for a median price of $235,000, marking a 4.82% increase from December 2024’s median price of $224,200. However, this represents a 6.00% decrease from November 2025, when the median sold price was $250,000. The median list price in December 2025 was $200,000, a significant decrease of 14.89% compared to $235,000 in December 2024.
The number of home sales also saw a decline, with 239 homes sold in December 2025, down 9.47% from 264 sales in December 2024. These figures highlight a dynamic market environment, Continue Reading →
By Dennis Norman, on December 21st, 2025
The St. Louis City real estate market saw a significant increase in home prices during November 2025, with homes selling for a median price of $250,000. This marks a 25.00% rise from November 2024, where the median sold price was $200,000. Additionally, last month’s median price reflects a 12.16% increase from October 2025’s median of $222,900. Despite the rising prices, the market experienced a decrease in the number of home sales, with 211 homes sold in November 2025, down 14.57% from 247 sales in November 2024.
Interestingly, while sale prices have surged, the median list price saw a decline. In Continue Reading →
By Dennis Norman, on November 21st, 2025
The St Louis City real estate market showed a dynamic shift in October 2025, with homes selling for a median price of $223,000. This marks a 6.19% increase compared to October 2024’s median of $210,000. However, it also reflects an 8.98% decrease from September 2025, when the median sold price was $245,000. The median list price for homes in October 2025 was $205,000, representing a 10.87% drop from $230,000 in October 2024. Additionally, home sales totaled 255, down 16.12% from 304 sales in October 2024.
The chart below, available exclusively from MORE, REALTORS®, illustrates these market trends and provides further Continue Reading →
By Dennis Norman, on October 21st, 2025
The St. Louis City real estate market continues to show dynamic changes as of October 2025. Homes sold for a median price of $245,000 in September 2025, marking an impressive 11.36% increase from the median price of $220,000 in September 2024. This upward trend also reflects a 4.26% rise from August 2025, when the median sold price was $235,000.
Interestingly, while the median sold price has increased, the median list price in September 2025 was $220,000, down 4.35% from $230,000 in September 2024. Additionally, the number of home sales in St. Louis City decreased by 9.93%, with 245 homes sold Continue Reading →
By Dennis Norman, on September 21st, 2025
The St. Louis City real estate market in August 2025 saw notable changes compared to the previous year. Homes sold for a median price of $235,000, marking a 7.55% increase from August 2024’s median of $218,500. However, this figure reflects a 5.05% decrease from July 2025, when the median sold price was $247,500. The median list price in August 2025 also rose to $235,000, up 6.82% from $220,000 in August 2024.
Despite these price increases, the number of home sales in St. Louis City decreased. In August 2025, there were 285 sales, a 6.25% drop from the 304 sales recorded Continue Reading →
By Dennis Norman, on August 21st, 2025
The St. Louis City real estate market has experienced notable shifts as of August 2025. Homes in the area sold for a median price of $247,250 in July 2025, marking a 9.89% increase from July 2024 when the median price was $225,000. However, this figure also represents a 4.52% decrease compared to June 2025, when the median sold price was $258,965. The median list price in July 2025 was $248,950, up 13.16% from $220,000 in July 2024, indicating a robust increase in seller expectations.
Despite the rise in prices, the number of home sales has decreased. In July 2025, there Continue Reading →
By Dennis Norman, on July 21st, 2025
The St. Louis City real estate market witnessed notable fluctuations in June 2025. Homes sold for a median price of $259,000, marking a 5.13% decrease from June 2024, when the median sold price was $273,000. However, this figure also represents a significant increase of 12.61% compared to May 2025, where the median sold price stood at $230,000. The median list price in June 2025 was $255,000, showing a decrease of 5.52% from $269,900 in June 2024.
In terms of sales volume, the St. Louis City market experienced a growth, with 291 homes sold in June 2025—an increase of 7.78% from Continue Reading →
By Dennis Norman, on June 21st, 2025
The St. Louis real estate market has shown nuanced shifts in May 2025, with the median home selling price reaching $230,000, a slight increase of 0.88% compared to May 2024. This price reflects stability in the market, albeit slightly down by 4.17% from April 2025, where the median selling price was $240,000. The median list price, however, saw a more positive year-over-year growth, setting at $230,000 in May 2025, up by 3.39% from the previous year.
In terms of sales volume, St. Louis experienced a slight decrease, with 329 homes sold in May 2025, down by 3.80% from 342 homes Continue Reading →
By Dennis Norman, on June 14th, 2025
The St. Louis City real estate market has shown varied dynamics as of May 2025. Homes sold for a median price of $230,000, marking a slight increase of 0.88% from May 2024, when the median sale price was $228,000. This figure, however, reflects a decrease of 4.17% compared to April 2025, when homes were selling at a median price of $240,000. The median list price in May 2025 also showed an upward trend, standing at $230,000, which is a 3.39% increase from the previous year’s $222,450.
In terms of sales volume, there were 329 home sales in May 2025, a Continue Reading →
By Dennis Norman, on April 21st, 2025
The St. Louis City real estate market demonstrated a robust increase in home prices during March 2025, according to the latest data. Homes sold for a median price of $220,000, marking a significant 4.76% rise from the previous year’s median of $210,000. This upward trend is further highlighted by a 10.03% increase from February 2025, where the median sold price was $199,950. Additionally, the median list price in March climbed to $222,450, up 11.23% from $200,000 in March 2024.
Despite the increase in prices, the number of home sales experienced a slight decline. There were 206 homes sold in March Continue Reading →
By Dennis Norman, on March 21st, 2025
The latest data from the St Louis City real estate market shows a decrease in home prices compared to the same time last year. According to the chart below, exclusively available from MORE, REALTORS®, the median sold price for homes in the St Louis City update was $200,000 in February 2025, a 4.74% decrease from February 2024 when the median sold price was $209,950. This also represents a 10.91% decrease from January 2025, when the median sold price was $224,500.
In addition, the median list price for homes in the St Louis City update was $199,900 in February 2025, a Continue Reading →
By Dennis Norman, on February 21st, 2025
The St. Louis City real estate market continues to show strong growth in the new year. According to the latest data from MORE, REALTORS®, the median sold price for homes in the St. Louis City update was $224,000 in January 2025. This represents a 12.03% increase from January 2024, when the median sold price was $199,950. Additionally, last month’s median sold price of $224,000 saw a 1.21% increase from December 2024, when the median sold price was $221,325.
The median list price for homes in the St. Louis City update also saw a significant increase, rising to $225,000 in January Continue Reading →
By Dennis Norman, on December 21st, 2024
As of November 2024, the St Louis City real estate market continues to show strong growth and stability. According to data exclusively available from MORE, REALTORS®, the median sold price for homes in the St Louis City update was $205,000, representing a 3.80% increase from November 2023 when the median sold price was $197,500. However, this is a 4.65% decrease from October 2024 when the median sold price was $215,000.
The median list price for homes in the St Louis City update also saw an increase, rising to $209,000 in November 2024, a 4.55% increase from $199,900 in November 2023. Continue Reading →
By Dennis Norman, on November 21st, 2024
As of October 2024, the St Louis City real estate market is showing signs of stability, with a slight decrease in median sold price compared to the same time last year. According to data exclusively available from MORE, REALTORS®, homes in the St Louis City area sold for a median price of $215,500, a decrease of 0.05% from October 2023. This also represents a 2.82% decrease from September 2024, when the median sold price was $221,750.
However, it’s not all bad news for homeowners in the St Louis City update. The median list price for homes in the area increased Continue Reading →
By Michael Abernathy, on November 20th, 2024 
A recently released documentary sheds light on St. Louis’s rich architectural heritage, centered around its iconic use of brick. The film traces the city’s brick legacy, revealing how local clay, craftsmanship, and historical events like the 1849 fire shaped the city’s skyline. It explores not only the artistry and resilience of St. Louis’s brick buildings but also the challenges posed by neglect and urban decay. The full documentary is available below, offering an immersive dive into this fascinating history.
One highlight of the film is its emphasis on the unique aesthetic qualities of brick, as one contributor notes: “Brick Continue Reading →
By Dennis Norman, on October 21st, 2024
The real estate market in St Louis City has been on the rise, with home prices increasing steadily over the past year. According to the latest data from MORE, REALTORS®, the median sold price for homes in the St Louis City update during September 2024 was $222500, a 0.91% increase from the same time last year when the median sold price was $220500. However, there was a slight decrease of 2.20% compared to the previous month’s median sold price of $227500.
The median list price for homes in the St Louis City update also saw an increase of 2.38% from Continue Reading →
By Dennis Norman, on October 4th, 2024 
St. Louis voters will have the opportunity to vote on Proposition V this November, a charter update designed to give the city stronger tools to hold negligent property owners accountable. Currently, fines for ordinance violations related to vacant and non-owner-occupied deteriorated properties are capped at $500—a limit that has remained unchanged since the 1970s. Proposition V, introduced by Alderwoman Daniela Velazquez, aims to remove this outdated cap and empower the city to set fines that can be adjusted based on the severity of the violations.
The proposed bill, Board Bill Number 72, states that the cap has become ineffective over Continue Reading →
By Dennis Norman, on March 4th, 2024 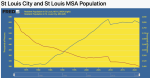
As the table and charts below illustrate, the St. Louis Metropolitatn Area (MSA) has undergone significant demographic shifts over the past 50 years, marked by a stark contrast between the population trends in the City of St. Louis and its surrounding counties.
St Louis MSA and Major Counties Population 1970-2022
The decline in the City of St. Louis’s population sharply contrasts with the growth in surrounding counties. During the same period that St. Charles County witnessed a 345% increase and the St. Louis MSA as a whole saw nearly a 60% rise, the City of St. Louis Continue Reading →
By Dennis Norman, on October 12th, 2023 During the 3rd quarter of this year, there were 1,200 properties with foreclosure filings in the St. Louis MSA, according to the U.S. Foreclosure Market Report by ATTOM Data. This marks a 17% increase in St. Louis foreclosures from the prior quarter and an increase of 32% in St Louis foreclosure activity from a year ago.
The table below reveals that the city of St Louis saw the most foreclosures during 3rd quarter, followed by the Illinois counties of St Clair and Madison.
Search St Louis Homes For Sale Search St Louis Foreclosed Homes For Sale
St Louis Continue Reading →
By Dennis Norman, on September 29th, 2023 As a result of rising interest rates and home prices at levels higher than increases in income, homes in St Louis continue to become less affordable. In fact, according to data just released by ATTOM Data Research, home affordability declined double digits during the 3rd quarter of this year in all five counties that make up the St Louis core market. As the info graphic below illustrates, the percentage of wages needed to buy a home have, depending upon county, increased about a third to almost half from the historical “norm”.
Least affordable ever…
Three of the five counties that Continue Reading →
By Dennis Norman, on August 22nd, 2023 Last month, city of St Louis mayor, Tishaura Jones, signed into law a new ordinance which provides “access to legal representation for tenants facing eviction or equivalent proceedings”. Surprisingly, it does not appear that the tenant needs to show a final hardship or need for “full legal representation” to be provided at no cost as the bill defines a “covered individual” as “any residential tenant who occupies a dwelling located within the City under a claim of legal right, other than the legal property owner of the dwelling.” Another interesting thing in the ordinance is that it appears to include Continue Reading →
By Dennis Norman, on July 26th, 2023 There were 4,017 building permits issued for new single-family homes in the St Louis area during the 12-month period ended June 30, 2023. This represents a decrease of 11.05% from the prior 12-month period, during which 4,516 permits were issued, according to the latest data from the Home Builders Association of St. Louis & Eastern Missouri (St Louis HBA). Six of the seven counties covered in the report saw a decline in building permits from the previous period, with the City of St Louis and Lincoln County experiencing double-digit declines.
Search St Louis Homes For Sale Search St Continue Reading →
By Dennis Norman, on March 9th, 2023
A new report just released by ATTOM Data revealed that nearly one of every four homeowners (24.3 %) in the city of St Louis that have a mortgage, are underwater on equity (meaning property owner owes at least 25% more on their home than the current value). At the other end of the spectrum was St Charles County where just 3.9% of homeowners with a mortgage are underwater.
Below is a list of the larger counties in the St Louis MSA and the percentage of the mortgages in the respective county that was underwater during the 4th Continue Reading →
By Dennis Norman, on February 6th, 2023 According to data released by ATTOM Data Research, during the fourth quarter of 2022, 35.7% of the homeowners with a mortgage within the 63118 zip code, were seriously underwater on their mortgage, meaning their mortgage balance exceeds the value of their home by 25% or more. The table below shows the 10 St Louis zip codes with the highest percentage of seriously underwater mortgages. Half of zip codes on the list are located within the City of St Louis and the other half are located in North St Louis County.
Also shown on the table is the percentage of homeowners Continue Reading →
By Dennis Norman, on October 7th, 2022 There were 4,486* building permits issued for new single-family homes in the St Louis area during the 12-month period ended August 31, 2022, a decrease of 8.93% from the same period a year ago when there were 4,926 permits issued, according to the latest data from the Home Builders Association of St. Louis & Eastern Missouri (St Louis HBA). Six of the seven counties covered in the report saw a decrease in building permits from the same period a year ago with four of the counties haveing a double digit decline.
*The city of St Louis did not report Continue Reading →
By Dennis Norman, on January 15th, 2022 There were 4,851 building permits issued for new single-family homes in the St Louis area during the 12-month period ended November 30, 2021, an increase of 3.17% from the same period a year ago when there were 4,702 permits issued, according to the latest data from the Home Builders Association of St. Louis & Eastern Missouri (St Louis HBA). Three of the seven counties covered in the report saw an increase in building permits from the same period a year ago, two of those, Franklin County and the City of St Louis, a double-digit increase.
Search St Louis Homes For Continue Reading →
By Dennis Norman, on July 30th, 2021 For the past couple of years now you’ve heard how low the inventory of homes for sale is, and, if you are a buyer, you have no doubt experienced some grief or hardship in buying a home as a result. However, this may be changing. As the table below shows, there are currently 3,565 active listings in the St Louis 5-county core market (city of St Louis and counties of St Louis, St Charles, Jefferson and Franklin) which based upon the rate of home sales, works out to a supply of 1.41 months. This is a 50% increase from the Continue Reading →
By Dennis Norman, on March 9th, 2021 In spite of having been in a low-inventory market for the past few years, home sales in St Louis have continued strong. In fact, as the home sales trend chart below, exclusively available from MORE, REALTORS®, shows home sales trend for the 12-month period ending February 28th was at the highest level in over 10-years.
The chart includes the St Louis 5-County core market (the city of St Louis and the counties of St Louis, St Charles, Franklin, and Jefferson) and shows that for the 12-month period ending last month there were 28,571 homes sold (distressed home sales have been Continue Reading →
By Dennis Norman, on February 15th, 2021 It’s no secret that listings of homes for sale in St Louis are in short supply and for a while now new sales have outpaced new listings making it a challenge for home buyers. However, over the past couple of months, new sales of homes in St Louis County have outpaced new listings by a greater margin than neighboring counties. As can be compiled from the tables below, new sales of homes in the St Louis 5-County Core market during the last four months outpaced new listings during the same period by 12.7%. For St Louis county, there were 6,095 Continue Reading →
|
Recent Articles
Helpful Real Estate Resources
|

