By Dennis Norman, on May 13th, 2021 Every month Fannie Mae surveys consumers about owning and renting a home as well as about other issues related to the housing market and economy and from the results publish their Home Purchase Sentiment Index® (HPSI). One of the components of the index is what the sentiment is on whether now is a good time to buy a home or sell a home. In the April 2021 HPSI 49% of consumers felt home prices would go up in the next 12-months and 54% felt interest rates would increase in the next 12-months.
[xyz-ips snippet=”Homes-For-Sale”]
[xyz-ips snippet=”Interest-Rates-and-Mike-McCarthy-Promo”]
Continue reading “About Half of Consumers Surveyed Think Home Prices and Interest Rates are Going Up“
By Dennis Norman, on May 12th, 2021 In spite of the challenge of a low-inventory housing market, St Louis City and County, St Charles County and Franklin County all saw double-digit increases in the number of homes sold in April while Jefferson County saw a double digit decline. As the charts below illustrate, the median price of homes sold in those counties increased from a year ago in all the counties, two of them in the double digits.
Not all housing data is the same….nor accurate for that matter…
One thing worth noting is that there are housing market reports out there from many different sources, including many credible ones that may or may not be accurate. In most cases this is not due to an error on the part of the person or entity sharing the data but a result of either bad data, inaccurate data or misinterpreted data. For example, when preparing to write this article I noticed two different reports on “St Louis” home prices for homes sold in April. One, which indicated it was for St Louis City and County combined, reported $250,000 and one which reported the “St Louis area” was $266,000. In the case of the latter, my first guess was that they were reporting data for the St Louis MSA but when I checked that the actual sold price in April was only $223,750 so I have no idea where the data came from. For the former, the $250,000 median price is not only higher than the median price for St Louis City and County, it’s higher than the median price for the whole MSA and while the source is indicated, I’m not sure how this number was arrived at.
So what does it matter?
In the crazy market we are in where buyers are getting in bidding wars to get a home, I think it’s more important than ever to have good, relevant and accurate data available to your agent so your agent can help you make an informed decision. You ultimately may decide to pay above what you think the current value of the home is but it would help to know what the real value is. If you look at my chart below for St Louis City and County you’ll see the median price of homes sold in April was $230,000 which is quite different than the $250,000 price and $266,000 I saw reported elsewhere. Would being $20,000 – $36,000 off on the value matter to you? I think it might.
So how do I know I’m right?
Well, for starters I’m a data junky and for the past dozen or so years I’ve probably spent, on average about a dozen hours a week or more studying market data for St Louis. In addition, for the past 6 or 7 years we have worked to develop our own proprietary software to compile and report housing data and are constantly checking and double checking the output. Finally, we have a very credible source for data, the REALTOR® MLS and we constantly update and check the data. Put all of this together and while there’s no way to say it’s 100% correct, but I’m confident it’s about as close as you can get.
[xyz-ips snippet=”Homes-For-Sale”]
Continue reading “St Louis Area Housing Market Report For April“
By Dennis Norman, on May 11th, 2021 While lately there’s been a lot of talk about the skyrocketing lumber prices and the impact on the cost of a new home but that’s not the only thing impacting the price of new homes. The National Association of Home Builders (NAHB) recently released the results of its 2021 Land Developer Survey on Regulatory Costs which, as the detailed table below shows, the average total cost of regulatory items in the price of a new home is $93,870. The NAHB in the same report indicates the average price of a new home is currently $397,300 so the cost of complying with regulatory issues makes up nearly 25%of the price (23.8%) of a new home.
The second table below breaks out the regulatory costs between ground development and home construction and, as it illustrates, the costs are fairly evenly divided between the two with ground development experiencing 10.5% cost for regulatory compliances and construction of the home itself 13.3%.
Continue reading “Nearly One-Fourth The Cost of a New Home is the result of regulatory costs“
By Dennis Norman, on May 5th, 2021 Lately, I’ve noticed several articles questioning whether the kind of crazy real estate market we’ve in for a while now is reminiscent of the early 2000’s which lead to a housing bubble that eventually burst in 2008. Granted, even in St Louis where we tend to not see the market extremes one way or the other like the coasts do, one could get the idea that maybe we’re headed that way with buyer’s fighting over new listings and bidding wars that have homes often selling for over the list price. However, in my humble opinion, this market is very different than the 2000 – 2007 market and we are not headed to a crash at this point.
Before I go further…my disclaimer…
I’m not an economist and I didn’t even stay at a Holiday Inn Express last night, I’m just a long-time real estate industry data junkie who has ridden the real estate roller coaster for 40+ years and have some thoughts on the current state of the market. While my comments may apply outside of our local market, my focus and commentary are on the St Louis housing market.
What’s different now from before…
[xyz-ips snippet=”Homes-For-Sale”]
Continue reading “Why St Louis Is Not Headed Toward Another Housing Market Bubble or Crash“
By Dennis Norman, on April 16th, 2021 With the inventory of homes for sale remaining at historically low levels for the last couple of years home buyers may be wondering why there aren’t more new homes being built? Actually, in St Louis, new home construction has been increasing at a pretty good rate but it appears more homes can be absorbed by the market than are being built.
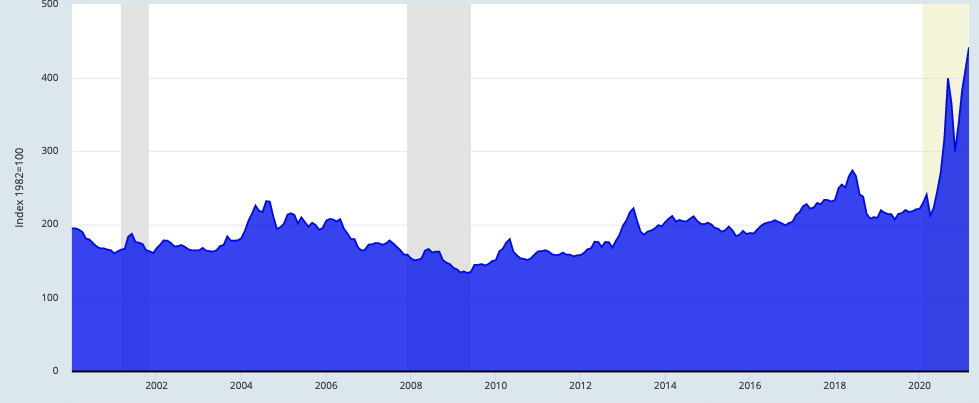
The answer to why more homes are not being built is probably the result of many things such as a lack of available ground in areas that are in demand, a shortage of contractors and tradesmen, the complication of, and cost related to regulatory compliance and the ever increasing cost of building materials. The cost of many building materials has increased significantly but lumber prices, which is a major component of a new home in many ways, have just shot into the stratosphere. As the chart below shows, the Producer Price Index for lumber and wood products shot up to 441 in March, an increase of 84% from a year ago.
According the National Association of Home Builders (NAHB) the price increases in lumber have caused the price of an average home to increase by $24,000 since April 2020 just to cover this increased cost.
Producer Price Index by Commodity: Lumber and Wood Products: Softwood Lumber
(click on chart for live chart and more data)
By Dennis Norman, on March 31st, 2021 There are a total of seventeen counties that make up the St Louis MSA with 9 of them being on the Missouri side of the Mississippi River and the other 8 on the Illinois side. For some reason, I was curious today if the portion of the St Louis MSA in one state was outperforming the other or if they were performing about the same. I guess my expectation was probably the latter but the data showed that in fact, during the past three months, they were closed, but each state has its bragging rights depending on which data point you look at.
The tables and charts below (available exclusively from MORE, REALTORS®) show more details but below are some highlights of the comparisons between the counties in the two states:
- Sold home prices in Missouri for December were at a median price of $226,500 in December then dipped in January, as expected but rebounded back in February to a median price of $225,000 or 99.3% of the December price. Illinois, on the other hand, had a median price of $150,000 in December then actually increased in January but then fell to $137,750 in February, or 91.8% of the December price.
- The number of home sales paints a different picture though. For the Missouri counties, there were 2,819 homes sold in December and 1,849 in February, for a decrease of 34%. In the Illinois counties, there were 744 homes sold in December and 554 in February for a 26% decrease.
[xyz-ips snippet=”Homes-For-Sale”]
Continue reading “Is The St Louis MSA Real Estate Market Better in Missouri or Illinois?“
By Dennis Norman, on March 19th, 2021 For the 12-month period ended February 28, 2021, there were 29,402 homes sold in the St Louis 5-County core market. As the 15-year chart below (available exclusively from MORE, REALTORS®) shows, this is the highest 12-month sales period in more than 15 years! Going back to 2006, a historic banner year for real estate, we find that the 12-month period ended March 31, 2006, came in close at 28,797 homes sold, but that’s a little over 2% below our most recent 12-month period.
But, can St Louis home sales keep up this pace?
Having a record-setting period for home sales is great but, practically speaking, it’s hard to sustain a record level for long so typically sales would ease after a record period and settle into a “norm”. Having been in this business for 40 years, I’ve seen many of these periods and the $64 question is always the same. How long can it last? I’m not going to even pretend I have that answer as there are too many variables including the continued impact of the pandemic on the economy and life in general, rising oil and gas prices, rising government debt, and uncertainty about the economy to name just a few. Oh, and did I mention the lack of inventory? It’s hard to maintain record sales levels when there are not enough products to sell.
[xyz-ips snippet=”Homes-For-Sale”]
Continue reading “St Louis 12-Month Home Sales Sets 15-Year Record In February“
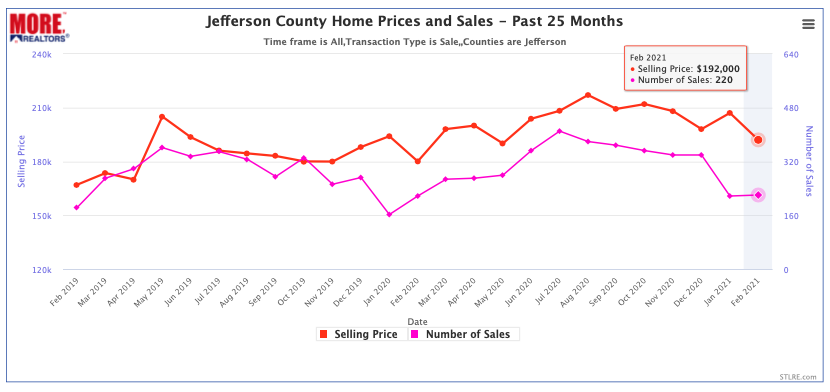
By Dennis Norman, on March 14th, 2021 As the chart below shows, the median price of homes sold in Jefferson County climbed to $200,413 in February from $192,000 the month before and sales plummeted from 220 in January to 81 in February.
In February last year, the median price of homes sold was $180,000 so the price of $200,413 last month represents an 11 percent increase. The number of homes sold in February 2020 was 217 so with just 81 homes sold last month, there was a 63% decline in sales for the month.
[xyz-ips snippet=”Homes-For-Sale”]
Jefferson County Home Prices and Sales
(click on chart for live chart)
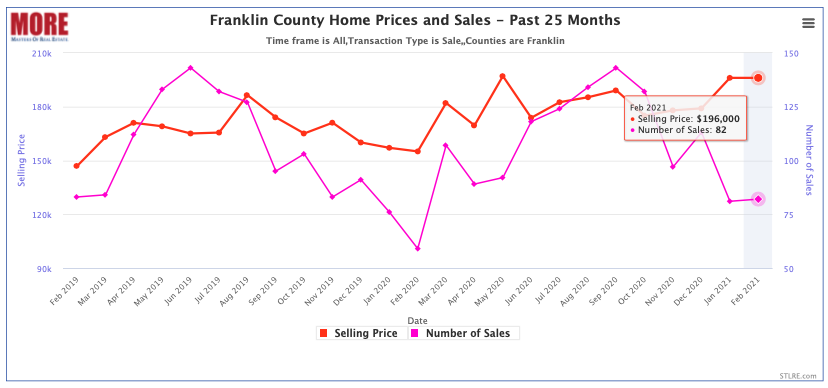
By Dennis Norman, on March 13th, 2021 As the chart below shows, the median price of homes sold in Franklin County remained at $196,000 in February the same as the month before. There were 82 homes sold in Franklin County in February, one more than the month before.
In February last year, the median price of homes sold was $155,000 so the price of $196,000 last month represents a 26 percent increase. The number of homes sold in February 2020 was 59 so the number of homes sold last month was 39% higher than a year ago.
[xyz-ips snippet=”Homes-For-Sale”]
Franklin County Home Prices and Sales
(click on chart for live chart)
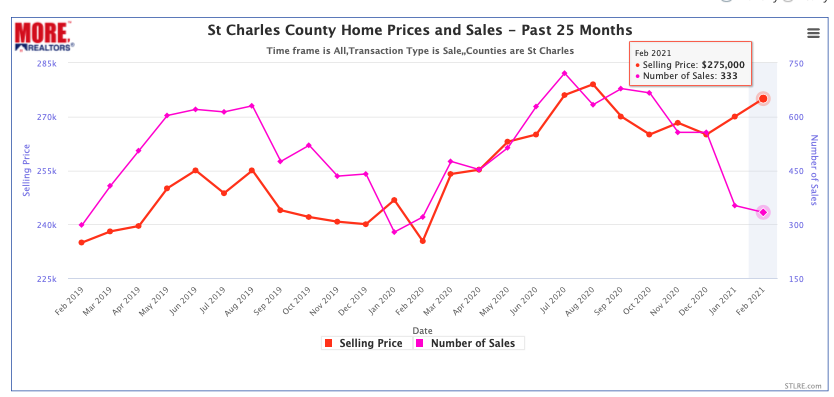
By Dennis Norman, on March 12th, 2021 As the chart below shows, the median price of homes sold in St Charles County jumped to $275,000 last month approaching the record-high price of $279,000 set this past August. This is the second consecutive month the median price has increased and is contrary to the norm. Last year home prices fell to a low of $235,000 in February.
Though home prices didn’t follow the typical pattern and fall during the winter in St Charles County, home sales did. Home sales last month followed that pattern falling to 333 homes sold, similar to last year’s February sales of 320 homes.
[xyz-ips snippet=”Homes-For-Sale”]
St Charles County Home Prices and Sales
(click on chart for live chart)
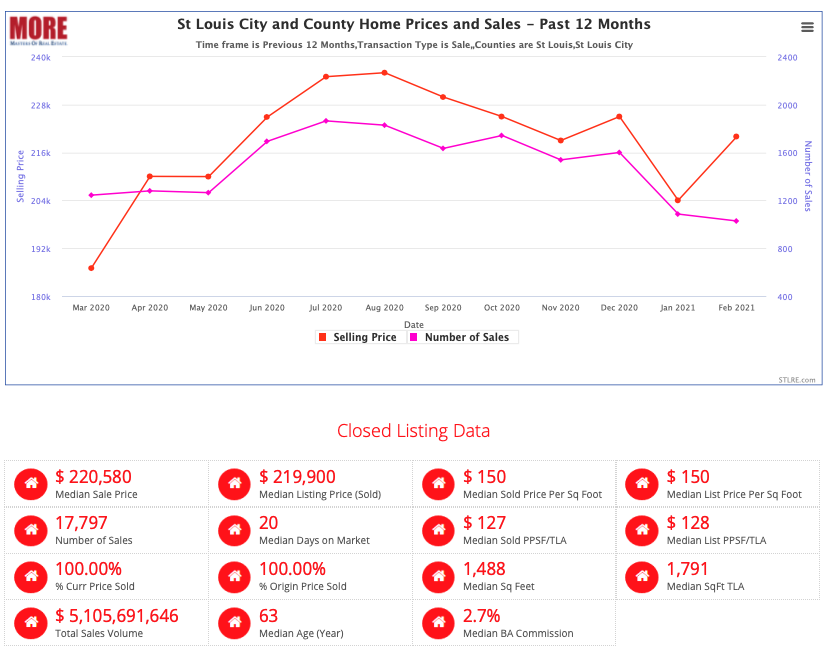
By Dennis Norman, on March 11th, 2021 As the chart below shows, the median price of homes sold in St Louis City and County jumped to $220,000 last month from $204,000 the month before. While home prices increased during the month, the number of homes sold fell slightly to 1,027 homes in the two-county area, down from 1,085 the month before.
As the table below the chart shows, there have been nearly 18,000 homes sold during the past 12 months in the City and County of St Louis at a median sold price of $220,580. The homes sold during the past 12 months sold for a median price of 100% of the original asking price and took a median time of just 20 days to sell. Can you say Seller’s Market? :)
[xyz-ips snippet=”Homes-For-Sale”]
St Louis City and County Home Prices and Sales
(click on chart for live chart)
By Dennis Norman, on February 20th, 2021 One of the many benefits to living in St Louis is it’s a very affordable place to live and much easier to be a homeowner than in most other major metro areas. Having said that, we do have areas, such as Ladue, Huntleigh, and Clayton to name a few where we do see home prices that are out of reach for most of the folks living here. One such example is a magnificent 10,000+ square foot Ladue manse that sold earlier this month. At a final sales price of $6,150,000, it is the highest-priced home sale in the REALTOR® MLS in more than 2 years.
See what $6 million gets you in a St Louis home by clicking here – be sure to click on the video to see the tour of this beautiful home.
[xyz-ips snippet=”St-Louis-Luxury-Homes-and-Condos-For-Sale”]
By Dennis Norman, on January 26th, 2021 It probably won’t come as a surprise that many of St Louis’ best school districts also have some of St Louis’ most expensive home prices. As the list below shows, the Ladue School district has the highest-priced homes with the average price for homes sold in the past 12 months at nearly $900,000. Of the top 10 highest priced school districts, 8 are in St Louis County, one in St Charles County and one in Franklin County.
St Louis 5-County Core’s Most Expensive School Districts
(click on list for complete list)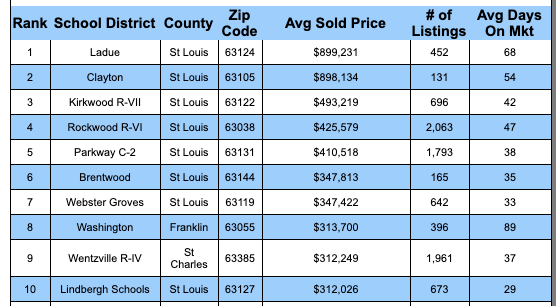
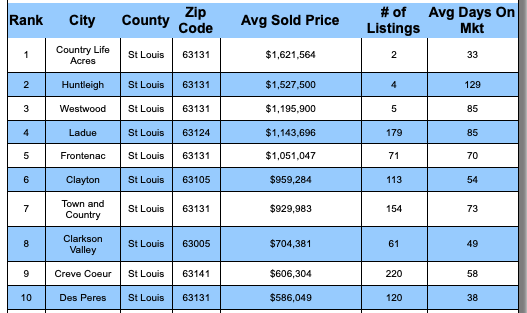
By Dennis Norman, on January 25th, 2021 One of the benefits to living in St Louis we often hear about is how affordable it is compared with many other metro areas around the country. Granted, one of the things that contribute to the “affordability” is the price of homes but that doesn’t mean we don’t have areas with pricey real estate here. The list below is part of the list showing what the average price homes sold for in every municipality in the St Louis MSA during the past 12 months and reveals the five municipalities where the average home price exceeded $1 Million.
Leading the list is the relatively small, but expensive, Country Life Acres where homes in the past 12 months sold for an average of $1,621.564.
[xyz-ips snippet=”Homes-For-Sale”]
St Louis 5-County CORE Market’s Most Expensive Municipalities
(click on list to see entire current list)
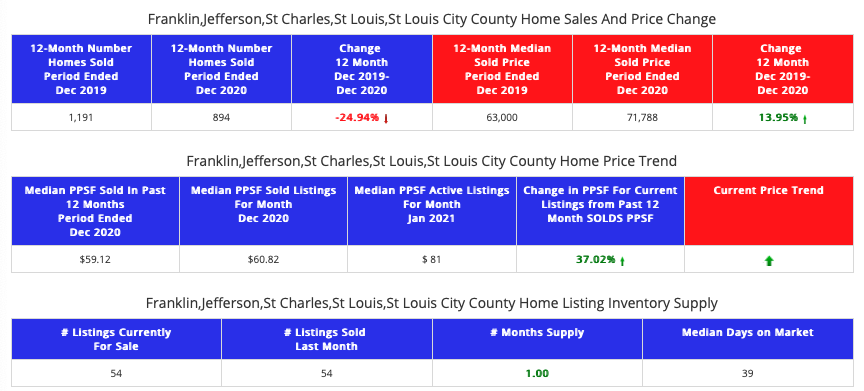
By Dennis Norman, on January 16th, 2021 As I reported a couple of days ago, home sales (non-distressed) in St Louis were up around 8% in 2020 verses 2019 however, distressed home sales were down 25% in 2020 from the year before. For several months of 2020, there were moratoriums on foreclosures which would lower the number of distressed sales and are no doubt largely responsible for the decline in sales. For the sake of this report, “distressed” sales include foreclosures, short sales, and property owned by banks or the government.
During 2020, there were 894 sales of distressed homes, down 25% from 2019 when there were 1,191 sales. The median price of distressed homes sold during 2020 was $71,788 an increase of nearly 14% from 2019 when the median price was $63,000. There are currently 54 active listings of distressed homes representing a one-month supply.
[xyz-ips snippet=”Foreclosures-For-Sale-and-Homes-For-Sale”]
STL Market Report – St Louis 5-County Core Market
(Distressed home sales only- click report for live report)
By Dennis Norman, on January 15th, 2021 Yesterday, I reported that St Louis area home sales and prices were both up about 8% during 2020 from 2019 so today we’ll take a look at how condominium sales and prices compared during the same period.
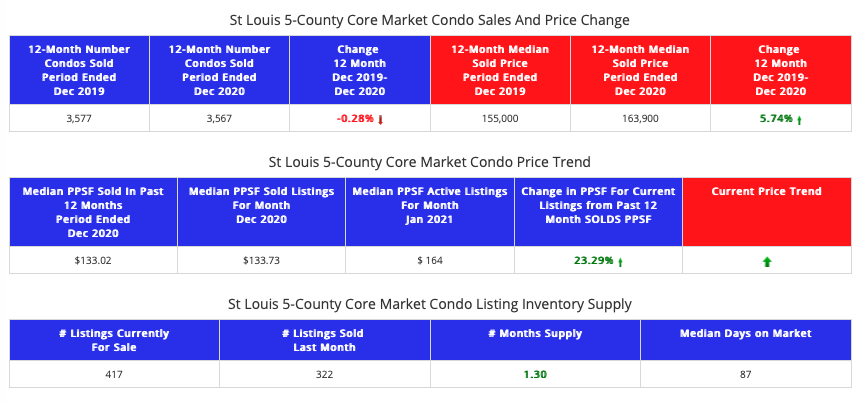
As the STL Market Report shows (available exclusively from MORE, REALTORS®), in the 5-County Core St Louis market there were 3,567 condominiums sold during 2020, 10 condominiums less than the 3,577 condominiums sold during 2019. The median price of condos sold in 2020 in this St Louis market was $163,900, an increase of 5.74% from 2019 when the median price was $155,000.
The current price trend, as depicted in the report, is up significantly with the median price per square foot of condos that are currently on the market being over 23% higher than the median price per foot of condominiums sold during 2020. There are currently 417 condos for sale in the St Louis 5-County Core market, representing a 1.30 month supply at the current sales rates.
[xyz-ips snippet=”Homes-For-Sale”]
STL Market Report for the St Louis 5-County Core Market Condos
(Non-distressed condo sales only – click on report for live report)
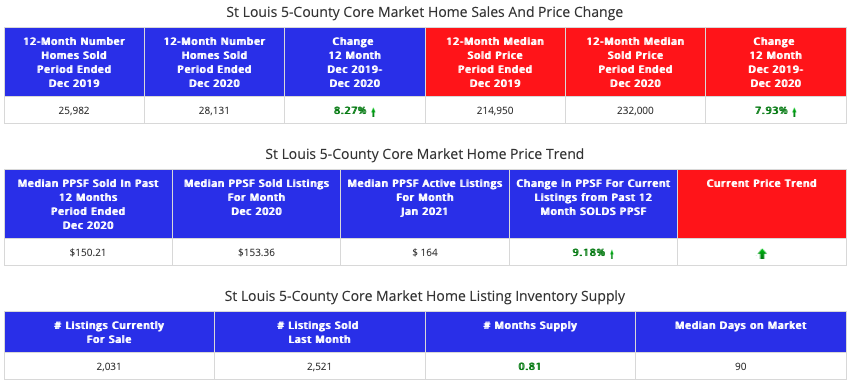
By Dennis Norman, on January 14th, 2021 In spite of the challenges from the COVID-19 pandemic, stay at home orders, a shaky economy and a fair amount of social unrest, 2020 still managed to be a good year for residential real estate! As the STL Market Report shows (available exclusively from MORE, REALTORS®), in the 5-County Core St Louis market there were 28,131 homes sold during 2020, an increase of 8.27% from 2019 when there were just 25,982 homes sold. The median price of homes sold in 2020 in this St Louis market was $232,000, an increase of 7.93% from 2019 when the median price was $214,950.
The current price trend, as depicted in the report, is up as well with the median price per square foot of homes that are currently on the market being over 9% higher than the median price per foot of homes sold during 2020. There are currently 2,031 active listings on the market representing a 0.81 month supply at the current sales rates.
[xyz-ips snippet=”Homes-For-Sale”]
STL Market Report for the St Louis 5-County Core Market
(Non-distressed home sales only – click on report for live report)
By Dennis Norman, on November 30th, 2020 Yesterday, I wrote an article titled “St Louis Home Sales – No end in sight?” in which one of my caveats had to do with listing inventory, noting the obvious that no matter how many homebuyers are out there, if there is nothing for them to buy, St Louis home sales will fall. As promised, I did an analysis of new listings and inventory using proprietary software we have developed at MORE, REALTORS to enable our agents to fully comprehend the market and be able to use that knowledge to serve their clients.
The first table below is our leading indicator report for new listings that were taken in the St Louis core market during the past week compared with the same week a year ago. As the table shows, listings for this period were up 18% from a year ago, which is good news but, as I reported yesterday, new sales were up 21% so sales rose at a higher rate than listings. The second table compares last week’s new listings with the prior week and, as yesterday’s home sales report showed, there was a decline, in the case of new listings taken they were down 5% from the prior week while yesterday I reported sales were down 10%. The report at the bottom is another proprietary product of MORE, REALTORS and it’s a report showing the current inventory of listings for sale in every zip code in the St Louis MSA of which I showed the 20 zips with the lowest inventory.
The bottom line…
To recap, new sales contracts written on listings in the past week outpaced the number of new listings by about 8% and new sales contracts written on listings in the past two weeks outpaced the number of new listings by nearly 11%. One thing to keep in mind is that a contract written does not equal a sold listing as a percentage of the contracts will fail to close due to building inspections, financing, appraisal issues, or other reasons so the gap is not quite as large as it may appear. The other thing to remember is the time of the year we are in…right before Thanksgiving is not a popular time for sellers to list their homes as many will wait until after Thanksgiving and some will wait until after Christmas. However, in today’s market, buyers don’t have that luxury…they have to be prepared to buy at any time or faced missing out in this tight market. So, for now, I think we’re ok and I think my caveat from yesterday is covered but I’ll be watching the inventory moving forward.
[xyz-ips snippet=”Homes-For-Sale-and-Listings-With-Virtual-Tours”]
Continue reading “New Listings Of St Louis Homes For Sale Trailing Sales Slightly“
By Dennis Norman, on July 2nd, 2020 Not only has it become common today for homes to sell as soon as they hit the market but receiving offers from multiple buyers and at prices that equal or even exceed the asking price is common as well. While this is an illustration of Economics 101, the rule and supply and demand, when the demand exceeds the supply (such as in the housing market in many price ranges and areas), prices increase this can also be a reminder of times past when home prices rose quickly for several years, then retreated rather abruptly. The most recent example of this, and arguably the worst during my 40 years in the real estate business, was the housing bubble that burst in 2008 sending home prices into a downward trend that lasted about 3 years.
So, are we headed to another housing bubble?
My focus is primarily on the St Louis housing market so I will focus on that but I will point out what I see with regard home prices, St Louis has a better outlook than at the national level.
[xyz-ips snippet=”Homes-For-Sale-and-Listings-With-Virtual-Tours”]
Continue reading “Have Home Prices Increased Too Much Too Fast? Is A Correction Coming?“
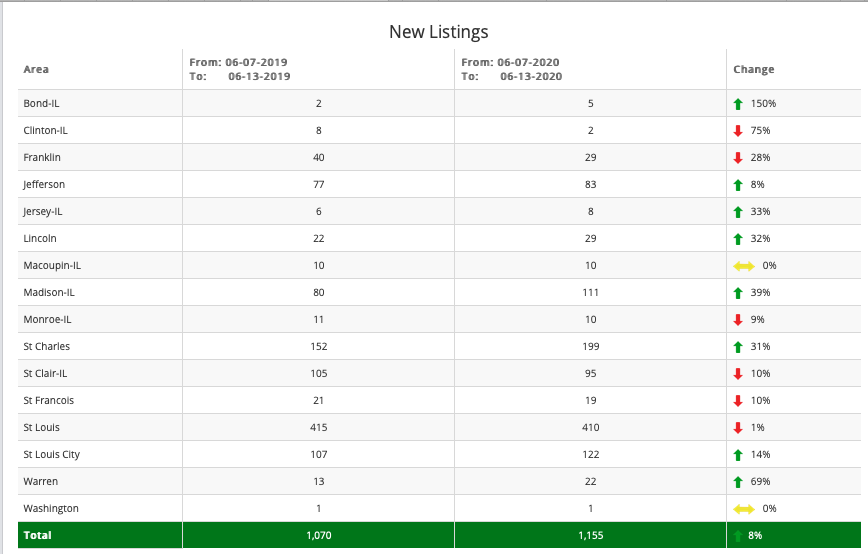
By Dennis Norman, on June 20th, 2020 Yesterday, I shared a report on new sales of listings in the St Louis MSA which showed sales were up 10% for the week from a year ago. Today, I created the report below which shows new listings during the same week, and while the number of new listings was up 8% for the week from a year ago, they still didn’t keep pace with the new sales. As the report reveals, there were 1155 new listings in the St Louis MSA last week and, as yesterday’s report showed, 1245 sales, so nearly 8% more new sales than new listings.
[xyz-ips snippet=”Homes-For-Sale-and-Listings-With-Virtual-Tours”]
New Residential Listings – St Louis MSA
For the Week Ended June 13, 2020
Data Source: MARIS – Copyright 2020, MORE, REALTORS All Rights Reserved
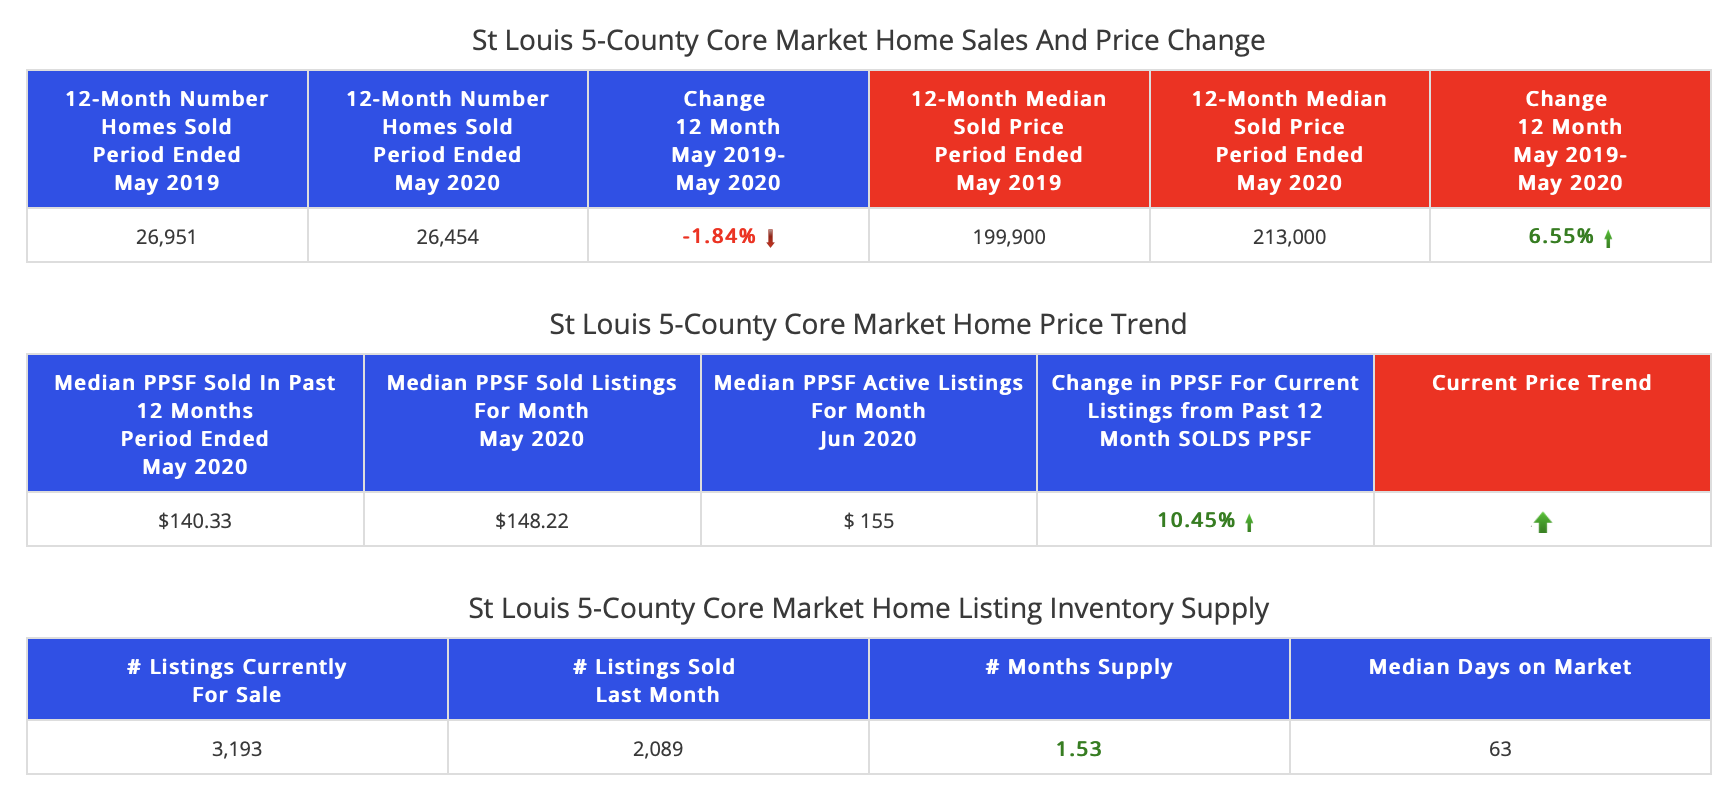
By Dennis Norman, on June 9th, 2020 The St Louis real estate market slowed when the effects of COVID-19 hit the St Louis area in early March but after continuing at a slower pace for a few weeks has quickly shifted gears to a faster pace. The St Louis market has improved to the point that, for the 12-month period ended May 31, 2020, St Louis home sales were down just 1.84% from the prior 12-month period. The median price of homes sold during the past 12-months was $213,000, an increase of 6.55% from the prior period.
[xyz-ips snippet=”Homes-For-Sale-and-Listings-With-Virtual-Tours”]
St Louis 5-County Core Market Home Sales and Prices
Past 12 Months vs Year Ago
(click on the table below for live report)
By Dennis Norman, on May 26th, 2020 While COVID-19 has not released it’s grip on us, it has eased the grip and certainly, this is true with regard to the St Louis real estate market. As I’ve written about recently, showings of listings have increased to the point they have outpaced the same time as last year and now, the number of new contracts on listings is just about there as well!
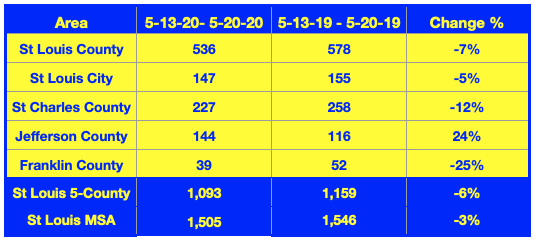
As the table below shows, the number of new contracts on residential listings in the last 7 days that have been reported is, for the St Louis MSA, down just 3% from the same time last year and for the St Louis County Core market, down just 6%. Jefferson County has actually seen sales that top the same period last year by 24%.
[xyz-ips snippet=”Homes-For-Sale-and-Listings-With-Virtual-Tours”]
St Louis New Contracts On Residential Listings For The Past 7 Days
By Dennis Norman, on May 21st, 2020 It’s no wonder home buyers are tripping over themselves and getting into bidding wars to buy a house as the supply of homes for sale is at or near historic lows. As our table below shows, there are currently 40 zip codes in the St Louis MSA with a one-month or less supply of homes for sale (7 of the zips have no homes for sale) and a total of 76 of the 127 (60%) zip codes within the St Louis MSA have a supply of homes for sale of 2 months or less.
This low inventory, along with low-interest rates and pent-up demand from the COVID-19 induced stay at home orders, is creating a real feeding frenzy of sorts for homebuyers in the St Louis market. For sellers, this is a dream come true, plenty of demand and little competition! Granted, this is not true in all areas and all price ranges, but for the most common prices ranges in the more popular areas it is very true.
Sellers should sell now!
If you are someone that has been thinking about selling, I would act on those thoughts now and take advantage of the current low-inventory conditions. While I don’t know that I agree, there are folks out there predicting that the market is going to get flooded with homes for sale shortly turning the tide on sellers. For me, I’ll believe that when I see it, but nonetheless, now is definitely a great time to sell.
[xyz-ips snippet=”Seller-Resources—Listing-Targeted”]
Continue reading “40 Zip Codes In The St Louis MSA Have 1 Month Or Less Supply Of Homes For Sale“
By Dennis Norman, on May 3rd, 2020 Prior to COVID-19, there had already been a shortage of residential listings for sale in many areas and price ranges through St Louis going back a couple of years. However, the problem may be getting worse as we are continuing to see new sales of residential listings in St Louis picking up the pace to the point that they are down just 16% from the same time a year ago but, new listings in the St Louis MSA are down 30% from the same time a year ago.
Since we started with a low inventory and now have the sales rate outpacing the listing rate, we are probably going to see an even tighter supply of homes for sale for at least the near future. As our table below shows, there are some areas where this is even more pronounced, such as St Charles County where the number of new sales of residential listings for the most recent 7-day period is down just 3% from a year ago but new listings during the same period are down 37%.
St Charles County down to less than 2-month supply
As our tables at the bottom shows, currently, there is just a 1.97 month supply of homes for sale in St Charles County and, if we look at the “sweet-spot” of homes priced in the $150,000 – $300,000 range, there is an inventory of just 1.04 months. If you own a home in St Charles County and have thought about selling, contact us now and let us show you how to leverage this market in your favor whileit lasts.
[xyz-ips snippet=”Homes-For-Sale-and-Listings-With-Virtual-Tours”]
Continue reading “St Louis New Listings Down Nearly Double What Sales Are From Last Year“
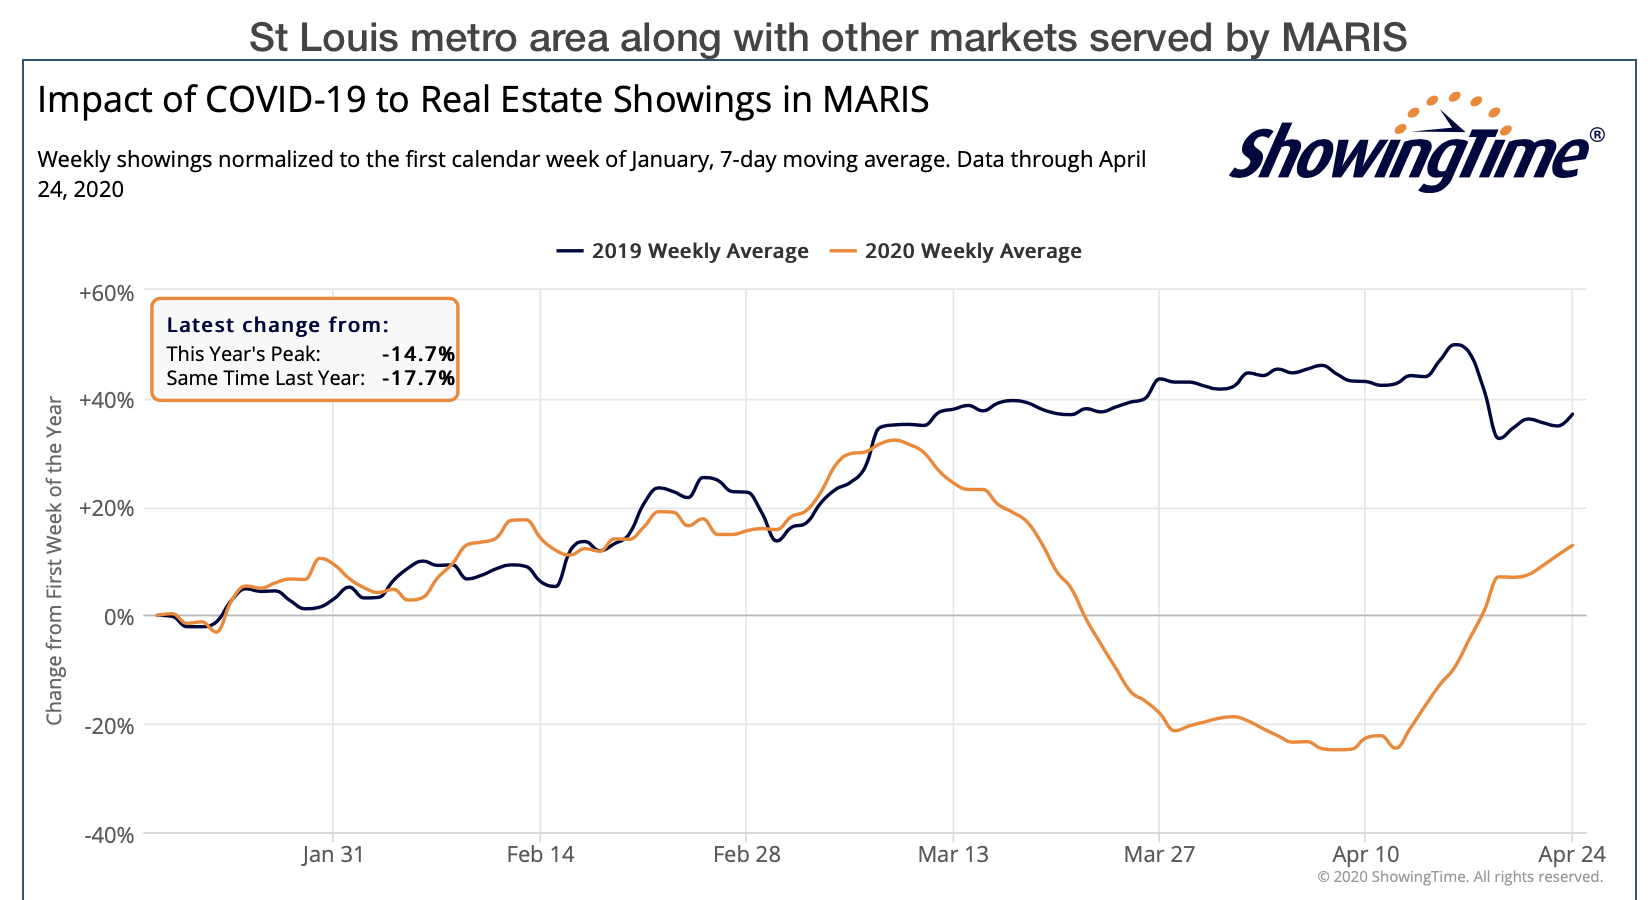
By Dennis Norman, on April 25th, 2020 Yesterday, I wrote about how St Louis home sales were on the rebound based upon the latest contract data which showed the number of new contracts on listings in the St Louis MSA had declined by just 16% from the same time a year ago. The question is, will that trend continue? Well, a very good, and reliable, leading-indicator of home sales is home showings, and, as the chart below shows, showings of listings in the St Louis MSA has been on the rise over the past two weeks. As of yesterday, showings were down just 17.7% from the same time last year for the St Louis MSA. This would suggest that, absent something happening to disrupt it, the home sales trend I reported yesterday may continue.
[xyz-ips snippet=”Homes-For-Sale”]
[xyz-ips snippet=”Seller-Resources—Listing-Targeted”]
Showings Of Listings in the St Louis metro area
(click on chart for current, live-interactive chart)
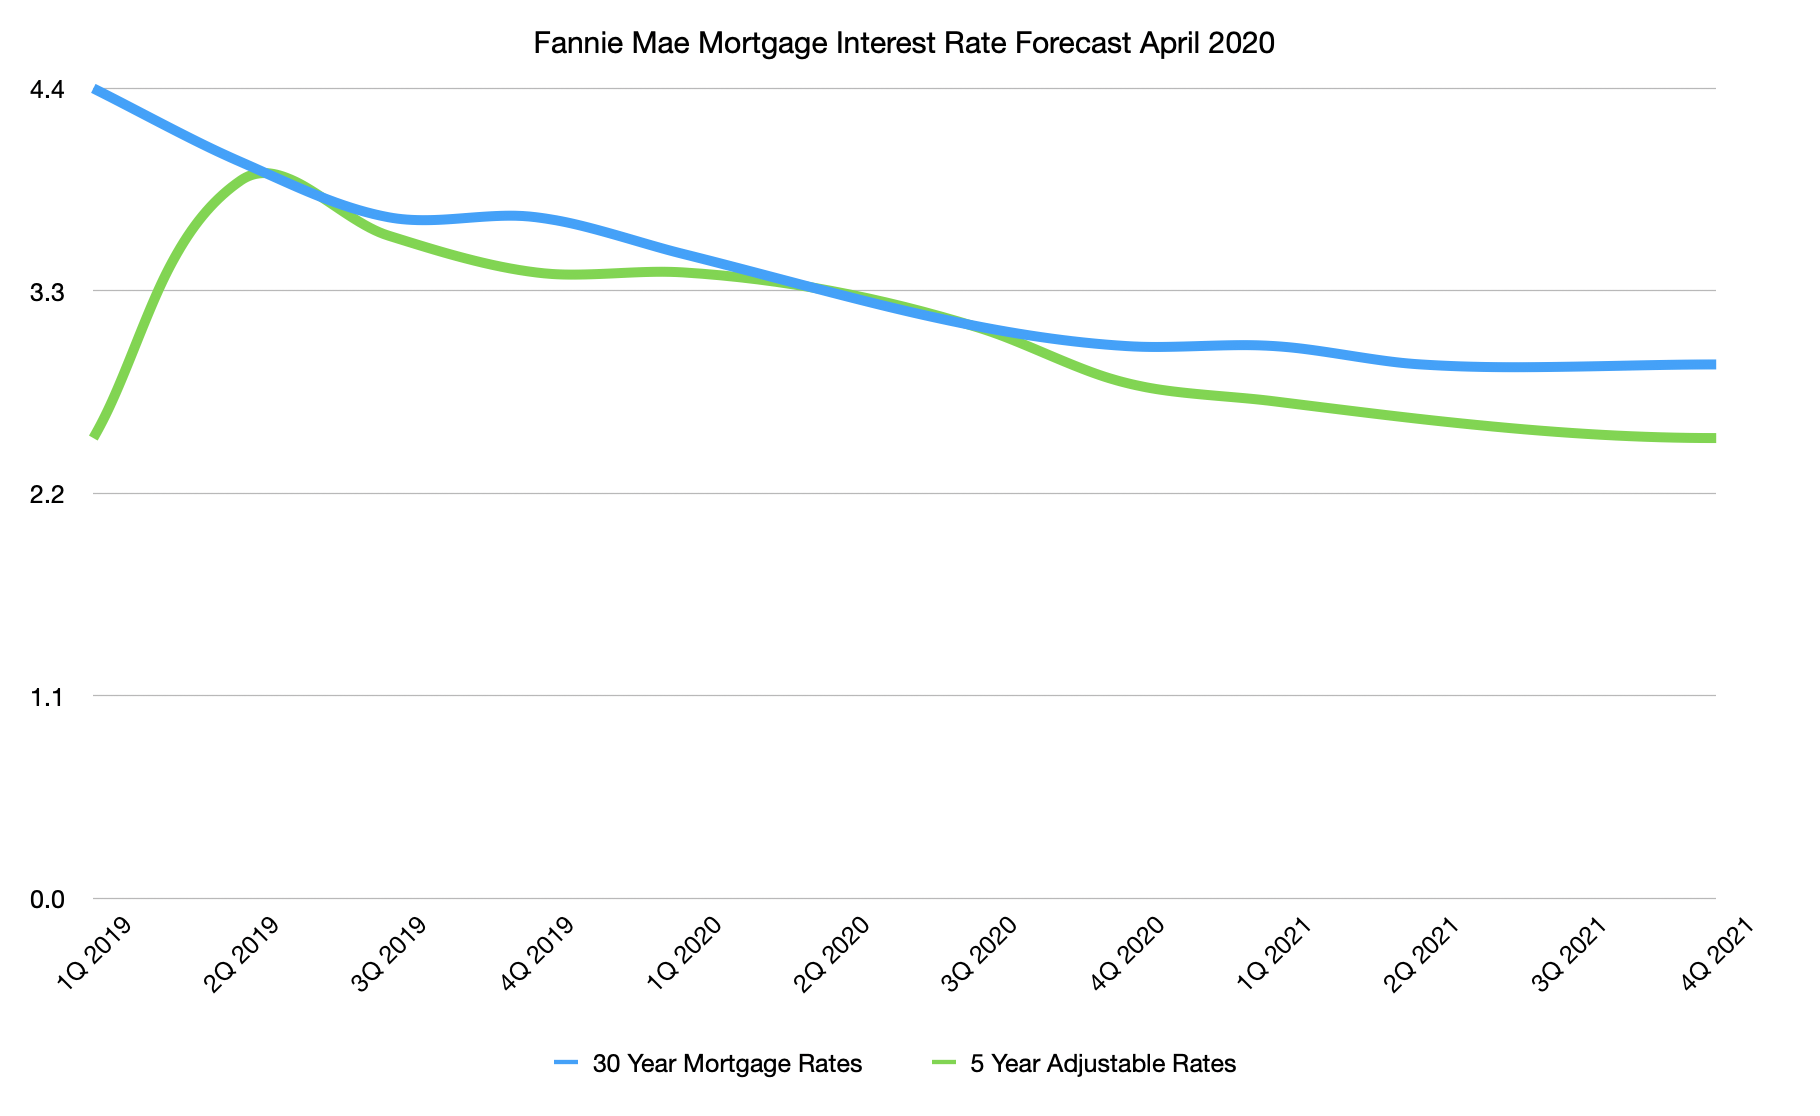
By Dennis Norman, on April 23rd, 2020 Fannie Mae issued their monthly housing forecast for April which includes, among other data, a forecast of what mortgage interest rates will be in the coming months. Last months forecast had projected that mortgage rates would continue to decline moving forward but only to a low of 3.1% before the end of 2021 while the April forecast predicted the interest rate on a 30-year fixed-rate mortgage would fall to 2.9% in the 2nd quarter of 2021 and stay there through the balance of the year.
If you’re able, now’s the time to buy!
While the effects of the COVID-19 pandemic, such as job loss, is going to take some would-be home buyers out of the market, for those that are still able to buy, now is a great time to buy a home. There are many factors that play in favor of buyers today, such as the fact that there are about 1/3 fewer of them (buyers in the market) now than this time last year, sellers that want to have fewer people coming through their homes and interest rates. As our chart below shows, not only are rates low now, they are projected to go much lower even.
Why not wait until next year when the rates hit their lowest?
Good question, but there are several reasons not to wait. First off, the rates shown on my chart are “projections”, or to put it another way “an educated guess”, so there is no guarantee rates will actually come down as predicted. In addition, once the stay at home orders go away and we start moving back to something closer to normal, I anticipate there will be a flood of buyers to the market which, along with lower interest rates (if that happens) will likely drive home prices up. So, for buyers that are able, they may get a better buy today, with less competition, still get a good interest rate and then if rates do fall as predicted can easily refinance to take advantage of lower rates.
[xyz-ips snippet=”Homes-For-Sale”]
[xyz-ips snippet=”Interest-Rates-and-Mike-McCarthy-Promo”]
Fannie Mae Mortgage Interest Rate Forecast April 2020 (Chart)
Data source: Fannie Mae – Copyright ©2020 St Louis Real Estate News, all rights reserved
By Dennis Norman, on April 14th, 2020 The COVID-19 pandemic (coronavirus) began impacting the St Louis area just a little over a month ago and I’ve been tracking the impact on the St Louis real estate market along the way. From the outset, we have seen a decline in the number of new listings, new sales and physical showings of listings, however, overall the decline has remained fairly constant. New sales of listings for the St Louis area has pretty well hovered around a level equal to about tw0-thirds of the activity we saw at the same time last year.
Now that we are about a month into the “COVID-19 effect”, a few weeks into the stay at home orders and a few weeks into real estate agents adjusting to doing business in a different way, I wanted to take an in-depth look to see where we stand now. I’ll warn you in advance, this article is a little long, mainly because of tables and data, but I wanted to include as much data as I could to paint the complete picture of the market.
[xyz-ips snippet=”Homes-For-Sale”]
Home sales are the best indicator of market confidence….
Continue reading “The COVID-19 Impact On The St Louis Real Estate Market – One Month In“
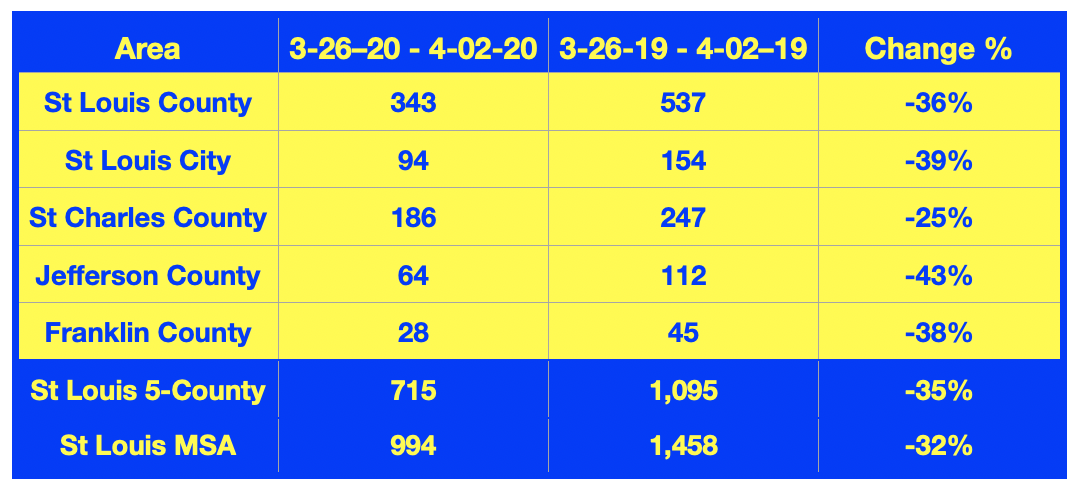
By Dennis Norman, on April 8th, 2020 Yesterday, I shared data showing that, in spite of the COVID-19 (coronavirus) pandemic, new sales of residential listings in the 5-county core St Louis market for the most recent 7-day period that complete data is available for, were down 35% from a year ago. I received requests to break the data down further so I did so by county. As the table below shows, for the 7-day period ended April 2nd, new sales of listings in St Charles County were down just 25% from the prior year. The reason the period ends April 2nd is REALTORS® has 3 business days to report new sales to the MLS so that means the deadline for reporting a new sale on April 2nd was last night so this data should be very accurate.
St Louis New Sales Of Residential Listings
3/26/20 – 4/02/20 Vs. One-Year Ago
Data source: Mid-America Regional Information Systems, Inc. – Copyright 2020 -has St Louis Real Estate News
[xyz-ips snippet=”Homes-For-Sale”]
By Dennis Norman, on March 14th, 2020 The St Louis real estate market is off to a great start for 2020! Home sales year to date has outpaced sales from the same time a year ago and everything points to 2020 being a good year for real estate! The $64 question is, however, what effect the Coronavirus may have on the market. Only time will tell, but my thoughts are that while there will no doubt be some negative impact on the St Louis housing market as a result of Coronavirus (COVID-19) its impact will be much less than what we have seen of late in the stock market.
I don’t believe we will see any sort of significant decline in home prices but we will likely see a “pause” in sales as some buyers decide to wait and see how things go. No doubt some of the potential buyers that will be affected are those whose jobs or income are impacted as a result of Coronavirus, such as people in the travel, hospitality, sports, and entertainment industries.
Rates jumped up last week but are still attractive. The week before last, St Louis mortgage interest rates hit an all-time low as buyers were locking in interest rates on a 30-year fixed-rate mortgage as low as 2.95%! This past week, however, that changed and the rates shot up by as much as 1% and not as a result of the stock market or coronavirus as much as from just too much demand. Apparently the investors that purchase the loans from lenders around the country got overwhelmed as the volume set record highs so they raised rates. Even with the increase, rates are still historically good.
[xyz-ips snippet=”Market-Update-Video–Inline-Link”] [xyz-ips snippet=”Market-Update-Video-Package”] [xyz-ips snippet=”Seller-Resources—Listing-Targeted”]
By Dennis Norman, on February 20th, 2020 Opportunity Zones were created by the 2017 Tax Cuts and Jobs Act that President Donald J. Trump signed into law on December 22, 2017. Opportunity zones were established to help communities that are economically-distressed and work by promoting private investment and development through the use of tax incentives. There are a total of 8.760 designated Qualified Opportunity Zones in the U.S. and there are 140 Opportunity Zones in Missouri.
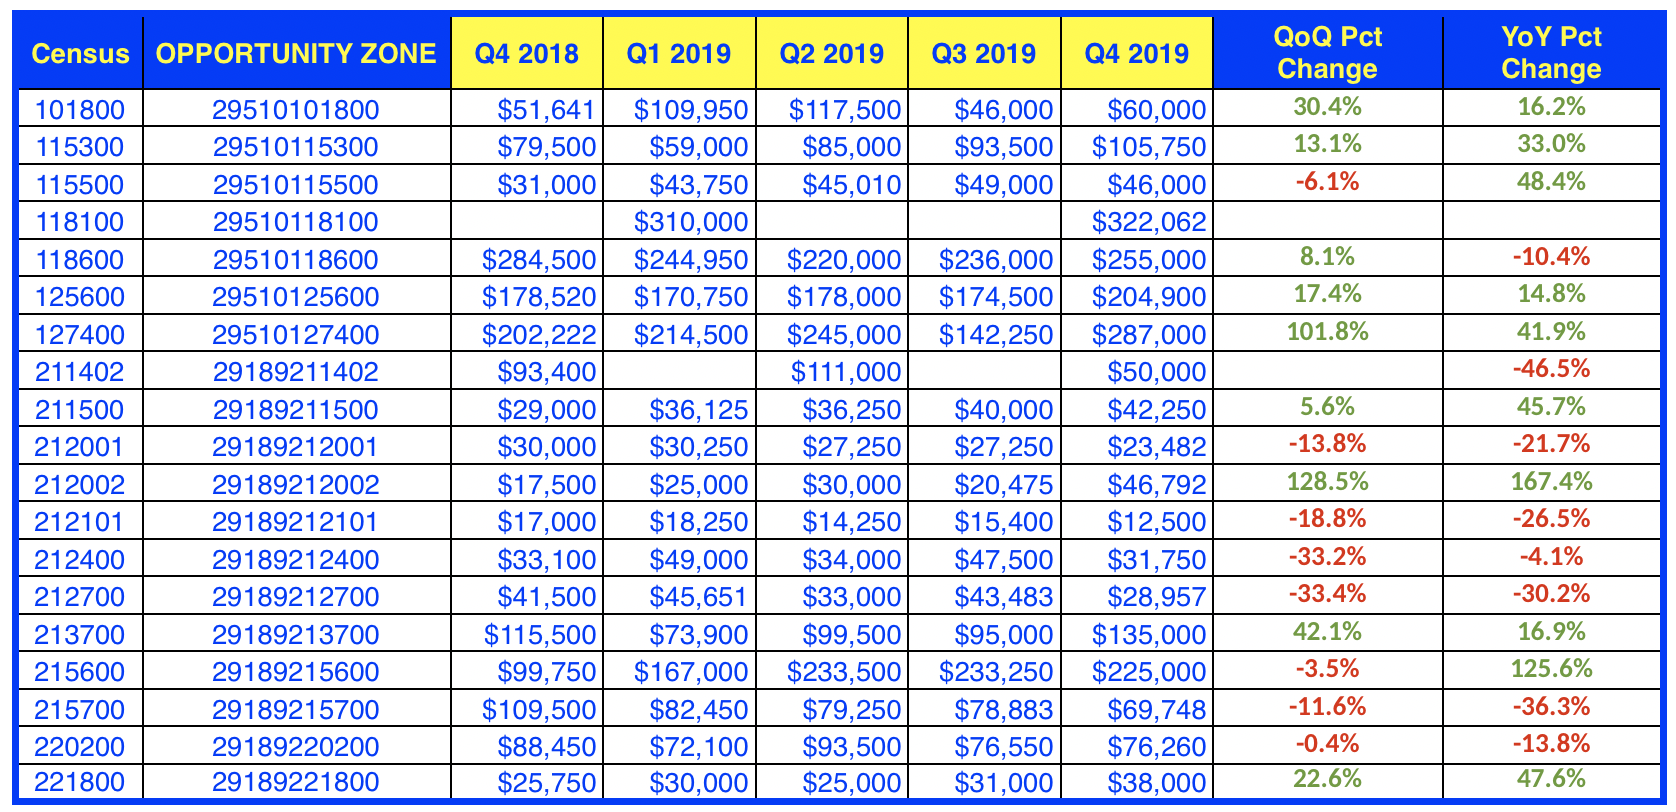
Opportunity zones appear to have had a positive impact on the housing market in several opportunity zones in the St Louis area. According to data just released by ATTOM Date Solutions, 10 of the 19 Opportunity Zones in the St Louis area have seen at least double digit increase in home prices in the past year and two of them triple digit increases!
You can find complete information about Opportunity Zones, including an interactive map for Missouri Opportunity zones, a complete list of all opportunity zones in the U.S. videos from webinars hosted by the Missouri Department of Economic Development (DED) and more at MissouriOpportunityZones.com
St Louis Area Opportunity Zones 4th Quarter 2019 Median Home Prices
|
Recent Articles
|


