November 2025 Real Estate Market Update: St. Charles County Sees Steady Growth

The St. Charles County real estate market demonstrated steady growth in October 2025, with homes selling for a median price of $365,000. This marks a 1.39% increase from October 2024, when the median sold price was $360,000. Additionally, the current median sold price reflects a 2.82% rise compared to September 2025’s $355,000. The median list price also saw a significant increase, reaching $437,163, up 21.77% from $359,000 in October 2024.

The market activity in St. Charles County remained strong, with 517 homes sold in October 2025, a 1.77% increase from the 508 homes sold during the same period last year. The chart below, available exclusively from MORE, REALTORS®, provides a detailed illustration of these trends, highlighting the robust performance of the St. Charles County real estate market. As always, MORE, REALTORS® is committed to providing the most accurate and up-to-date market insights for St. Louis, MO real estate and its surrounding areas.

October 2025 St. Charles County Real Estate Market Update: Trends and Insights

The St. Charles County real estate market has shown a slight upward trend in home prices as of September 2025. Homes sold for a median price of $355,000, marking a 1.43% increase from the median price of $350,000 in September 2024. However, this also represents a 1.39% decrease compared to August 2025, when the median sold price was $360,000. The median list price for homes was $353,769, reflecting a 2.54% rise from $345,000 in September 2024.

In terms of sales volume, there were 453 home sales in September 2025, which is a 3.00% decline from the 467 homes sold in September 2024. These statistics are part of a comprehensive analysis illustrated in the chart below, available exclusively from MORE, REALTORS®. This data provides valuable insights for those interested in the St. Louis, MO real estate market and highlights the ongoing trends affecting both buyers and sellers in the area.

St. Charles County Real Estate Market Update: September 2025 Insights

The St. Charles County real estate market experienced notable shifts in August 2025. Homes sold for a median price of $357,195, marking a 1.55% increase from the median price of $351,750 in August 2024. However, this figure represents a 2.80% decrease compared to July 2025, when the median sold price was $367,500. The median list price remained stable at $350,000, unchanged from August 2024.

In terms of sales volume, there were 475 home sales in August 2025, reflecting an 8.30% decline from the 518 homes sold in August 2024. For a visual representation of these trends, refer to the chart below, available exclusively from MORE, REALTORS®. This chart provides a comprehensive overview of the market dynamics and is a valuable resource for anyone interested in the St. Louis, MO real estate scene. For further insights and expert guidance, consider reaching out to MORE, REALTORS®, your trusted partner in navigating the St. Louis real estate market.

St. Charles County Real Estate Market Sees Steady Growth in July 2025

The St. Charles County real estate market demonstrated a robust performance in July 2025, with the median home selling price reaching $367,500, marking a 2.08% increase from the previous year. This figure slightly dipped by 0.68% from June 2025’s median selling price of $370,000. Despite the month-to-month fluctuation, the overall trend indicates healthy growth, as reflected in the median listing price of $365,000, up by 2.82% compared to July 2024.

The volume of home sales also showed positive momentum, with 577 homes sold in July 2025, an increase of 6.65% from 541 sales in the same month last year. This uptick in sales volume underscores a vibrant local housing market.

For a detailed visual representation of these trends, refer to the chart below, available exclusively from MORE, REALTORS®. This chart provides an in-depth look at the pricing and sales trends that are shaping the St. Charles County real estate landscape as of August 2025.

St. Charles County Real Estate Market Update: July 2025 Insights

The St. Charles County real estate market has experienced subtle yet consistent growth as of June 2025. The median selling price of homes reached $373,200, marking a 0.86% increase from June 2024’s median of $370,000. This price also reflects a steady rise from May 2025, maintaining the same 0.86% growth rate. Prospective buyers saw a slight uptick in median list prices, which escalated to $369,995 in June 2025, up by 1.37% from the previous year.

Despite the rising prices, the volume of home sales showed a minimal decline. In June 2025, the county recorded 516 home sales, slightly down by 0.19% from 517 sales in June 2024. This data, illustrated in the chart below, provides a clear view of the trends in St. Charles County’s housing market. For a comprehensive understanding and exclusive insights, the chart is available exclusively from MORE, REALTORS®. This information is crucial for anyone looking to make informed decisions in the St. Louis, MO real estate sector.

St. Charles County Real Estate Market Sees Price Increase in May 2025

The St. Charles County real estate market experienced a notable increase in home prices in May 2025. The median sold price for homes reached $370,000, marking a 5.41% rise from May 2024’s median of $351,000. This increase also represents a 2.78% growth from April 2025, where the median sold price was $360,000. Meanwhile, the median list price saw an uptick to $373,950, which is 6.84% higher compared to the same period last year.

Despite the rise in prices, the number of homes sold in May 2025 slightly decreased by 3.26%, with 504 homes sold compared to 521 in May 2024. This data, illustrated in the chart below, provides a clear view of the market trends in St. Charles County. For a detailed analysis and more exclusive charts, contact MORE, REALTORS®, who continue to provide expert insights into the St. Louis, MO real estate market.

St. Charles County Real Estate Market Sees Continued Growth in May 2025

The real estate market in St. Charles County has demonstrated robust growth as of May 2025, with significant increases in both median sold and list prices compared to the previous year. In April 2025, homes in St. Charles County sold for a median price of $375,000, marking a 4.17% increase from April 2024, when the median sold price was $360,000. This figure also represents a 1.35% rise from March 2025, where the median sold price was $370,000.

The median list price in April 2025 reached $374,400, up by 6.97% from $350,000 in April 2024. Additionally, the number of home sales has seen a notable uptick, with 406 homes sold in April 2025, a 10.03% increase from the 369 homes sold in April 2024.

For a detailed visual representation of these trends, refer to the chart below, exclusively available from MORE, REALTORS®. This chart provides a clear illustration of the ongoing upward trajectory in the St. Charles County real estate market, reflecting the growing demand and healthy market conditions as of May 2025.

St. Charles vs. St. Louis: Where the Real Estate Momentum Is Heading This Spring

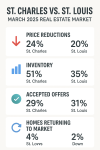
As the spring market picks up speed, St. Charles and St. Louis counties are showing some interesting contrasts in real estate activity — and for both buyers and sellers, the opportunities (and strategies) vary depending on where you’re standing.

We dug into the most recent local data comparing February to March 2025, and here’s what you need to know:


🔻 Price Reductions Are Dropping — And That’s a Seller Signal

In both St. Charles and St. Louis, the number of listings with price reductions declined noticeably:

  • St. Charles saw a 24% decrease

  • St. Louis experienced a 20% decrease

That drop suggests sellers are pricing more confidently — or seeing stronger interest up front. If you’re a homeowner considering listing, this may be your cue to strike while competition remains tight and buyers are motivated.


📈 Inventory Is Up — Especially in St. Charles

After a long stretch of low inventory, the spring surge is real:

  • St. Charles listings jumped 51%

  • St. Louis listings rose 35%

Buyers now have more options to choose from — which is great news for anyone who felt boxed in during the winter slowdown. And for sellers, it means a more competitive landscape where staging, pricing, and timing matter more than ever.


✅ Accepted Offers Are Climbing

Demand isn’t slowing — even with more listings hitting the market. In March:

  • St. Louis saw a 31% increase in newly accepted contracts

  • St. Charles followed closely with a 29% rise

Homes are still moving quickly — especially those that are well-presented and priced right from the start.


🔁 Fewer Homes Are Returning to Market

Another sign of increasing buyer confidence and stability:

  • St. Charles saw a 4% drop in homes coming back on market

  • St. Louis saw a 2% decrease

Fewer fall-throughs means deals are sticking — a positive sign for sellers looking for smoother closings and buyers aiming to avoid bidding wars or financing hiccups.


💡 What This Means for Buyers and Sellers

Whether you’re navigating St. Louis or exploring opportunities in St. Charles, one thing is clear: the spring market is active, competitive, and filled with potential.

For Buyers:
Now’s the time to make your move — more inventory gives you choices, but homes are still selling fast. A trusted agent (hi, that’s me 👋) can help you move quickly and confidently when the right one pops up.

For Sellers:
The market is rewarding homes that are prepped, priced, and positioned well. With fewer price reductions and solid buyer demand, this could be your window to sell successfully.


Ready to Make a Move?

Whether you’re buying, selling, or just market-curious — let’s talk. I bring data, strategy, and a bit of charm to the process (because real estate doesn’t have to be boring).

📲 Contact me today to put a plan in motion — and let’s make your next move your smartest one yet.
Karen Moeller
Karen.Moeller@stlre.com
314.678.7866
Then connect with MORE REALTORS to help make that happen!

St. Charles County Real Estate Market Update: April 2025 Insights

The St. Charles County real estate market has experienced subtle shifts in pricing and activity as of March 2025. Homes in the area sold for a median price of $370,000, reflecting a slight decrease of 0.24% compared to March 2024, when the median sold price was $370,900. However, this price represents an increase of 1.71% from February 2025, where the median sold price stood at $363,779. The median list price also saw an upward trend, settling at $369,700 in March 2025, marking a 1.29% increase from the previous year’s $365,000.

In terms of sales volume, there were 342 home sales in March 2025, showing a decrease of 2.01% from the 349 sales recorded in March 2024. This data suggests a competitive market with fluctuating prices and a slightly reduced sales activity. For a detailed visual representation of these changes, refer to the chart below, which is available exclusively from MORE, REALTORS®. This chart provides an in-depth look at the pricing trends and sales volumes, helping potential buyers and sellers make informed decisions in the St. Charles County real estate market.

St Charles County Real Estate Market Update: February 2025

The real estate market in St Charles County continues to show strength, with a median sold price of $362,559 in February 2025. This represents a 1.87% increase from the same time last year, when the median sold price was $355,900. Additionally, February’s median sold price is up 2.13% from January 2025, when it was $355,000.

According to the chart below, provided exclusively by MORE, REALTORS®, the median list price also saw a slight increase, going from $359,800 in February 2024 to $360,000 in February 2025. However, there were 233 home sales in February 2025, a decrease of 18.25% from the 285 sales in February 2024.

These numbers indicate a stable and competitive market in St Charles County, with a slight increase in prices and a decrease in sales. As always, it’s important to consult with a reputable real estate agent, such as those at MORE, REALTORS®, for personalized advice and guidance in navigating the St Charles County real estate market.

Whether you’re buying or selling a home in St Charles County, now is a great time to make a move. Contact MORE, REALTORS® today to get started on your real estate journey.

St Charles County Real Estate Market Update for January 2025

The real estate market in St Charles County saw a slight increase in median sold price during January 2025, according to the latest data from MORE, REALTORS®. Homes sold for a median price of $350,000, which is a 3.40% increase from the same time last year when the median sold price was $338,500. However, this also represents a 2.78% decrease from December 2024, when the median sold price was $360,000.

The median list price also saw an increase, rising to $350,000 from $339,999 in January 2024. This shows a 2.94% year-over-year increase in list price. In terms of sales, there were 257 home sales in St Charles County in January 2025, a slight decrease of 0.39% from January 2024.

The chart below, available exclusively from MORE, REALTORS®, illustrates the data for the St Charles County real estate market in January 2025. These numbers indicate a steady market for both buyers and sellers, with a slight increase in prices compared to last year. Stay tuned for more updates on the St Charles County real estate market from MORE, REALTORS®.

St Charles County Update: December 2024 Real Estate Market Trends

As of December 2024, the real estate market in St Charles County has seen a slight increase in median sold price compared to the previous year. According to the latest data available exclusively from MORE, REALTORS®, homes in the area sold for a median price of $360,000, a 0.63% increase from December 2023 when the median sold price was $357,750.

However, there was a slight decrease in median sold price from the previous month, November 2024, when the median sold price was $362,500. This represents a decrease of 0.69% from the current month’s median sold price.

The median list price for homes in St Charles County saw a 4.29% increase from December 2023, rising from $350,000 to $365,000. Despite this increase, there were 296 home sales in December 2024, a 5.73% decrease from the 314 home sales in December 2023.

These numbers suggest a stable market in St Charles County, with a slight increase in prices compared to the previous year. As we continue into the new year, it will be interesting to see how the real estate market in this area evolves. Stay tuned for further updates from MORE, REALTORS®.

St Charles County Real Estate Market Update: November 2024

The latest data from the St Charles County real estate market is in, and it’s showing positive signs for both buyers and sellers. According to the chart below, exclusively available from MORE, REALTORS®, the median sold price for homes in the update during November 2024 was $360,500. This represents a 3.00% increase from November 2023, when the median sold price was $350,000.

While the median sold price saw a slight decrease of 2.57% from October 2024, when it was $370,000, the overall trend is still on the rise. Additionally, the median list price for homes in the update was $359,900, a 2.86% increase from November 2023’s median list price of $349,900.

In terms of sales volume, there were 360 home sales in the St Charles County update during November 2024, a 4.05% increase from the 346 sales in November 2023. This indicates a healthy and active market for both buyers and sellers.

If you’re in the market for a home in St Charles County, now is a great time to buy. And if you’re considering selling, the market is showing strong demand and increasing prices. Don’t miss out on this opportunity to make a move in the St Charles County real estate market. Contact MORE, REALTORS® today for expert guidance and assistance.

St Charles County Real Estate Market Update as of October 2024

The real estate market in St Charles County continues to show strong growth as we head into the final months of 2024. According to the latest data from MORE, REALTORS®, the median sold price for homes in the St Charles County update during October 2024 was $370,000, representing a 5.74% increase from the same time last year. This also marks a 2.46% increase from September 2024, when the median sold price was $361,113.

The median list price for homes in the St Charles County update was $375,000, a 7.14% increase from October 2023. And with 406 home sales in October 2024, there was an 11.23% increase in sales compared to October 2023.

As shown in the chart below, exclusively available from MORE, REALTORS®, the St Charles County real estate market has been steadily on the rise. This is great news for both buyers and sellers, as it indicates a strong and competitive market. If you’re looking to buy or sell a home in St Charles County, now is the perfect time to make your move.

At MORE, REALTORS®, we are dedicated to providing our clients with the most up-to-date and accurate information on the St Charles County real estate market. Our team of experienced and knowledgeable agents are here to help you navigate the buying and selling process with ease. Contact us today to learn more about how we can assist you with your real estate needs in St Charles County and beyond.

St Charles County Update: September 2024 Real Estate Market

The real estate market in St Charles County saw a slight increase in median sold price during September 2024. According to the latest data from MORE, REALTORS®, homes in the st charles county update sold for a median price of $365000, which is 1.53% higher compared to September 2023 when the median sold price was $359500.

This also marks a 0.00% increase from August 2024, when the median sold price was $365000. The median list price in September 2024 was $365000, showing a 2.47% increase from $356200 in September 2023. These numbers indicate a steady and strong market in St Charles County.

In terms of home sales, there were 391 homes sold in September 2024, a 7.42% increase from 364 in September 2023. This data shows a positive trend in the real estate market in St Charles County, with both median sold and list prices on the rise.

For a visual representation of the data, refer to the chart below, available exclusively from MORE, REALTORS®. As we move further into the fall season, it will be interesting to see how the market continues to perform in St Charles County. Stay tuned for more updates on the real estate market in St Charles County from MORE, REALTORS®.

St Charles County Real Estate Market Update: August 2024

As of August 2024, the St Charles County real estate market saw a slight decrease in median sold price compared to the same time last year. According to data exclusively available from MORE, REALTORS®, homes in the St Charles County update sold for a median price of $363,500, a 0.41% decrease from August 2023. This also represents a 2.94% decrease from July 2024, when the median sold price was $374,500.

However, the median list price for homes in St Charles County showed an increase of 1.36% from $360,000 in August 2023 to $364,900 in August 2024. This indicates that sellers are still able to command higher prices for their homes in this market.

In terms of home sales, there were 419 transactions in August 2024, a 12.16% decrease from the 477 sales in August 2023. This could be attributed to a decrease in inventory or a decrease in buyer demand.

Overall, the St Charles County real estate market remains stable with a mix of both positive and negative indicators. As always, for the most up-to-date and accurate information on the St Charles County market, contact MORE, REALTORS® for expert guidance and assistance.

St Charles County Real Estate Market Update as of August 2024

The real estate market in St Charles County continues to show steady growth as we enter the month of August. According to the latest data from MORE, REALTORS®, the median sold price for homes in the county was $375,000 in July 2024, a 4.17% increase from the same time last year. This also marks a slight decrease of 4.03% from June 2024.

The median list price for homes in St Charles County was $369,900, a 5.69% increase from July 2023. This indicates a strong demand for homes in the area, as sellers are able to list their homes at higher prices.

In terms of home sales, there were 455 transactions in July 2024, a 3.17% increase from July 2023. This shows a continued trend of a healthy and active real estate market in St Charles County.

For a visual representation of this data, please refer to the chart below, available exclusively from MORE, REALTORS®. As always, our team of experienced and knowledgeable agents are here to assist you with all of your real estate needs in St Charles County and beyond. Contact us today for more information.

St Charles County Real Estate Market Update as of July 2024

The real estate market in St Charles County has continued to show strong growth and stability as of July 2024. According to the latest data from MORE, REALTORS®, the median sold price for homes in the county during June 2024 was $391,500, representing an increase of 7.26% from the same time last year when the median sold price was $365,000. This also marks a 6.41% increase from May 2024, when the median sold price was $367,900.

The median list price for homes in St Charles County was $379,900 in June 2024, a significant increase of 8.54% from $350,000 in June 2023. However, there was a slight decrease in the number of home sales in the county, with 423 sales in June 2024 compared to 490 in June 2023, a decrease of 13.67%.

As seen in the chart below, provided exclusively by MORE, REALTORS®, the St Charles County real estate market has been steadily growing and remains a strong market for both buyers and sellers. With a median sold price of $391,500 and a median list price of $379,900, it is clear that homes in this area are in demand and selling for top dollar.

If you are looking to buy or sell a home in St Charles County, now is a great time to do so. With the help of a knowledgeable and experienced REALTOR from MORE, REALTORS®, you can navigate the market with confidence and achieve your real estate goals. Contact us today to learn more about the current market trends and how we can assist you in your real estate journey.

St Charles County Real Estate Market Update as of June 2024

The real estate market in St Charles County continues to show strength and growth, with the median sold price for homes increasing by 5.71% in May 2024 compared to the same time last year. According to the chart below, available exclusively from MORE, REALTORS®, the median sold price for homes in the St Charles County update was $370,000, up from $350,000 in May 2023. This also marks a 2.78% increase from April 2024, when the median sold price was $360,000.

The median list price for homes in St Charles County also saw an increase of 5.82% from May 2023, reaching $364,989. Additionally, there were 433 home sales in May 2024, a significant 11.31% increase from 389 in May 2023.

These numbers indicate a strong seller’s market in St Charles County, with high demand and rising prices. As a leading real estate agency in the area, MORE, REALTORS® can provide expert guidance and assistance for those looking to buy or sell in St Charles County. Stay tuned for more updates and insights on the St Louis, MO real estate market.

St Charles County Real Estate Market Update as of May 2024

The real estate market in St Charles County, MO continues to show strength and stability as we head into the summer months. According to the latest data available exclusively from MORE, REALTORS®, the median sold price for homes in the St Charles County update was $360,000 in April 2024. This represents a 2.06% increase from April 2023, when the median sold price was $352,750.

While there was a slight decrease of 2.82% from the previous month, when the median sold price was $370,450, the overall trend for home prices in St Charles County remains positive. Additionally, the median list price for homes in April 2024 was $350,000, which is the same as it was in April 2023.

The number of home sales in St Charles County also saw an increase, with 365 homes sold in April 2024. This is a 4.89% increase from April 2023, when there were 348 home sales.

As the market continues to show stability and growth, now is a great time to buy or sell a home in St Charles County. Contact MORE, REALTORS® for expert guidance and assistance with all of your real estate needs.

Missouri Homeowners Insurance Holds Steady Amid National Crisis Concerns

The St. Louis Business Journal today published an article with the headline “A hidden cost of homeownership is mounting — and approaching crisis levels”. The article began with “homeowners across the country are facing an insurance crisis — and it’s driving up housing costs”, and then quoted a study indicating that 72% of U.S. homeowners said the cost of their homeowners insurance had increased over the past year. Well, sometimes it’s better to not have ocean views, mountains, and the like, and to be situated in the middle of the country like we are here in St. Louis—and this would be one of those occasions.

Homeowners Insurance Not Projected to Increase in Cost in 2024:

According to a study by Insurify, home insurance rates are expected to rise by 6% this year after a 20% increase over the last two years. However, the study indicates that in Missouri, the average cost of homeowners insurance in 2023 was $2,706 and for 2024 it’s projected to be $2,697. So, no increase in Missouri and actually a few bucks in savings.

Within Missouri, the cost of insurance varies by location. Here are a few examples of the average monthly quote for homeowners insurance for several cities within Missouri:

  • Florissant – $206
  • St. Charles – $186
  • St. Joseph – $213
  • St. Louis City – $232
  • Springfield – $224

There are many factors that come into play regarding the cost of insurance beyond the location, such as the home’s replacement cost. This figure represents the cost to rebuild your home using similar materials and is influenced by several factors, including the age of your home, its square footage, architectural style, and the local rebuilding costs in your area. Coverage options also play a vital role. Homeowners who opt for additional coverages, such as protection for sewer lines, natural disasters, and high-value possessions, will generally see an increase in their insurance rates.

This is why it’s important to have a knowledgeable insurance agent and preferably one with access to coverage from many different companies to help you select the right company and coverage for your situation. A good place to start is STLBestInsuranceAgent.com, where you can find many helpful short videos about homeowners insurance, particularly from the standpoint of a homebuyer.


Most Expensive States for Home Insurance in 2024

Most Expensive States for Home Insurance in 2024

St. Louis Area Residential Real Estate Market Report For March 2024

The St. Louis MSA residential real estate market is experiencing a phase of transformation. While the sales volume has seen a downturn, median sale prices have held steady, indicating a resilient market underpinned by solid demand.  The complete STL Market Reports for the entire metro area as a whole, as well as the major counties, are available exclusively from MORE, REALTORS® and are below.

Key Findings:

  • Sales Volume Decline: The St. Louis MSA experienced a 9.30% decrease in the number of homes sold during the 12-month period ending March 31, 2024, compared to the previous year.
  • Median Sold Price Growth: Despite decreased sales, median sold prices rose by 2.40% from $248,000 to $253,950 during the same period.
  • Price Per Square Foot (PPSF):  The PPSF of current listings is 3.74% than the PPSF of homes that sold during the prior 12-months. This suggests an adjustment in the market with current listings being priced lower than what was sold in the past year.
  • Inventory and Supply:  There is currently a 1.07 months supply of homes for sale, indicating a tight inventory reflective of a seller’s market.
  • Median days on the market: The median time on the market of current listings is just 22 days, showing homes are selling relatively quickly.

County Highlights:

  • St. Louis City and St Louis County:
    • A decrease of -5.14% in homes sold year-over-year.
    • A reduction in median sold price by -1.21%.
    • A significant drop in PPSF for current listings by -15.93% compared to the last 12 months.
  • St. Charles County:
    • The number of homes sold dropped by -14.64%.
    • Median sold prices increased by 5.97%.
    • PPSF for current listings increased by 12.61%, signaling strong market growth.
  • Franklin County:
    • A decrease of -9.72% in homes sold year-over-year.
    • Median sold prices increased by 9.09%.
    • PPSF for current listings rose by 8.86%.
  • Jefferson County:
    • The number of homes sold decreased by -16.63%.
    • An increase in median sold prices by 4.02%.
    • A substantial increase in PPSF for current listings by 12.63%.

Market Implications:

The St. Louis MSA real estate market is currently defined by a decrease in the number of homes sold but a general uptrend in prices. The PPSF analysis reveals a market correction, yet the trend suggests prices might increase shortly.

  • For Sellers: The current market presents an opportunity due to low inventory levels and a consequent seller’s market, indicated by the low months’ supply.
  • For Buyers:  The decreased competition and market adjustment could benefit buyers, yet they should be mindful of the resilient pricing trends.

The real estate landscape in the St. Louis metro requires careful navigation, with sellers possibly leveraging the low supply and buyers staying cautious of the potential for increasing prices. Stay informed with St. Louis Real Estate News for ongoing analysis and insights into local market trends.

Continue reading “St. Louis Area Residential Real Estate Market Report For March 2024

St Louis Area New Home Building Permits Decline In All Counties Except St Charles

During the 12-month period ending February 29, 2024, there were 3,993 building permits issued for new single-family homes in the St. Louis area. This figure marks a 4.29% decrease from the previous 12-month period, which saw 4,172 permits issued, as per the latest data from the Home Builders Association of St. Louis & Eastern Missouri (St. Louis HBA). The downturn was observed in all counties except St Charles County, with three of them experiencing double-digit declines.


St Louis New Home Building Permits – February 2024

(click on table below for page with live charts showing additional permit data)St Louis New Home Building Permits - February 2024


St. Louis Metro Real Estate Market: Interpreting the Current Trends

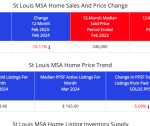
The St. Louis Metro residential real estate market in 2024 is showcasing diverse trends, indicating an evolving landscape for buyers, sellers, and industry professionals. The latest data, detailed in the STL Market Report exclusively from MORE, REALTORS®, offers a snapshot of these dynamics.

Contrasting Sales Trends:

  • There’s a notable decrease in home sales volume by 16.11% in the past year, with figures declining from 38,173 to 32,022 homes sold.

Home Value Resilience:

  • Despite the lower sales volume, median sold prices in the metro area nudged upward by 2.44%, moving from $246,000 to $252,000 year-over-year.

Price Per Square Foot (PPSF) Analysis:

  • The average PPSF for homes sold over the last 12 months stands at $173.85. Listings this month are somewhat lower at $163.46 PPSF.
  • Active listings for the month are quoted at a PPSF of $165.00, indicating a tentative increase in asking prices.

Signs of Market Adjustment:

  • A reduction in PPSF by 5.09% for current listings compared to the PPSF of homes sold in the past year hints at a market adjustment.
  • The current price trend arrow points upwards, suggesting that prices might be starting to rise again despite the recent cooling off.

Inventory and Supply Dynamics:

  • With 2,498 listings currently for sale and 2,051 homes sold last month, inventory levels are tight.
  • The months’ supply of inventory is low at 1.22, indicative of a seller’s market.
  • Homes are selling relatively swiftly, with the median number of days on the market being 27.

The St. Louis Metro real estate market’s recent performance, detailed in the report shown below, reveals a complex picture. Sales volume is down, yet home values are resilient, even with the lower PPSF for current listings. This discrepancy suggests that, although the pace of sales has slowed, the demand remains robust enough to support current price levels.

Sellers might see this as an opportunity, given the scarcity of inventory and the seller’s market indicated by the low months’ supply. However, buyers may benefit from less competition, even as they face persistent price strength. It’s a pivotal time for the market, and those involved will need to navigate these mixed signals with strategic planning and sound advice from experienced real estate professionals.

Stay tuned to St. Louis Real Estate News for detailed analyses and updates on our local market trends.


STL Market Report

(click on report below for live, current report)STL Market Report - St Louis Metro Area Home Prices and Sale


Demystifying Aluminum Wiring for Homebuyers: Insights from Industry Expert Mike Ragan

In a recent informative video, Mike Ragan, a master electrician, and owner of R&M Electric in St. Charles MO, dispels several myths surrounding aluminum wiring, a subject that often causes apprehension among prospective homebuyers in the St. Louis area. With over 18 years of experience specializing in residential wiring and troubleshooting, Ragan brings a wealth of knowledge to the discussion. He offers crucial insights for anyone considering the purchase of a home equipped with aluminum wiring, providing a fresh perspective on what has traditionally been viewed as a potential dealbreaker.

Ragan assures homebuyers, “Aluminum wiring is not necessarily a bad thing,” explaining that “if things are done correctly using the aluminum wiring, that it’s not dangerous.” He addresses the common fear surrounding aluminum wiring, which stems from its susceptibility to oxidation and the associated risks of overheating and fire hazards in older installations from the 1970s. However, he clarifies that with the correct installation and maintenance procedures in place, aluminum wiring is not inherently dangerous. Key to the safe use of aluminum wiring is the application of specific products like deoxidizing agents and the use of aluminum-rated devices, which prevent oxidation and ensure secure connections.

Moreover, Ragan highlights budget-friendly solutions for addressing aluminum wiring concerns, such as aluminum-rated connections or AlumiConn® connectors, whereby “you can significantly save money by going with the connections… less than half the cost by going through and redoing all the connections.” He strongly recommends that buyers considering a property with aluminum wiring engage a licensed electrician familiar with these issues to conduct a thorough inspection, thereby ensuring the wiring’s integrity and compliance with safety standards.

This dialogue not only educates homebuyers about the realities of aluminum wiring but also reassures them that, with proper attention and maintenance, homes equipped with aluminum wiring can be a safe, viable option. He says, “I would have no problem buying an aluminum wired house if the things we talked about were done correctly.” Ragan’s expertise offers practical guidance for navigating concerns related to aluminum wiring, empowering homebuyers to make informed decisions about their potential purchases.


Interview with St Louis Master Electrician Mike Ragan about Aluminum Wiring Concerns

St. Louis Metro Area Shrinks as Residents Flee Urban Core

The St. Louis Metro Area saw a continued population decline according to the latest U.S. Census Bureau estimates, which show the region’s population decreasing from 2,820,285 in April 2020 to 2,796,999 as of July 2023. This represents a loss of 23,286 residents, or a 0.83% decrease over the three-year period.  Looking at the one-year change, the St. Louis MSA population fell by 3,246, or 0.12%, from 2,800,245 in July 2022 to 2,796,999 in July 2023. Despite these decreases, St. Louis maintained its position as the 21st largest MSA nationally from 2020 to 2023.

Drilling down to the county level reveals that the population decline was not evenly distributed across the MSA. St. Louis County, the most populous county in the metro area, saw its population drop from 1,004,305 in April 2020 to 987,059 in July 2023, a loss of 17,246 residents or a 1.72% decrease. The City of St. Louis experienced an even sharper decline, falling from 301,565 to 281,754 over the same period, a decrease of 19,811 or 6.57%.

In contrast, some outlying counties in the MSA saw population growth. St. Charles County, the second most populous county in the region, grew from 405,271 in April 2020 to 416,659 in July 2023, an increase of 11,388 or 2.81%. Jefferson County’s population also increased, albeit more modestly, from 226,569 to 231,230, a gain of 4,661 or 2.06%.

Other Missouri counties in the MSA saw mixed results. Franklin County’s population rose from 104,689 to 106,404, an increase of 1,715 or 1.64%, while Lincoln County saw strong growth, increasing from 59,578 to 64,699, a gain of 5,121 or 8.59%. However, Warren County had a more moderate increase from 35,528 to 37,806, a growth of 2,278 or 6.41%.

In Illinois, the counties included in the St. Louis MSA also experienced population declines. Madison County’s population fell from 269,484 to 266,368, a loss of 3,116 or 1.16%, while St. Clair County saw a decline from 259,686 to 253,292, a decrease of 6,394 or 2.46%. Monroe County, however, remained relatively stable, with a slight increase of 4 residents or 0.02%, from 34,962 to 34,966.

The data shows that the St. Louis MSA’s overall population decline of 0.83% from 2020 to 2023 was driven largely by significant decreases in the core city of St. Louis (-6.57%) and St. Louis County (-1.72%), as well as declines in the Illinois counties of Madison (-1.16%) and St. Clair (-2.46%). While some suburban and exurban counties experienced population growth, such as Lincoln County (8.59%) and St. Charles County (2.81%), it was not enough to offset the losses in the urban core and Illinois portion of the MSA. This pattern of population shifts from urban to suburban/exurban areas within metro areas has been observed in many other regions across the country in recent years.


St Louis MSA Population Change 2020-2023 By County

County 2020 Population 2023 Population Change % Change
St. Louis County, MO 1,004,305 987,059 -17,246 -1.72%
St. Charles County, MO 405,271 416,659 11,388 2.81%
St. Louis City, MO 301,565 281,754 -19,811 -6.57%
Madison County, IL 269,484 266,368 -3,116 -1.16%
St. Clair County, IL 259,686 253,292 -6,394 -2.46%
Jefferson County, MO 226,569 231,230 4,661 2.06%
Franklin County, MO 104,689 106,404 1,715 1.64%
Lincoln County, MO 59,578 64,699 5,121 8.59%
Warren County, MO 35,528 37,806 2,278 6.41%
Monroe County, IL 34,962 34,966 4 0.02%


St Louis MSA Population – 1970-Present

(click on chart for live, interactive chart)

St Louis MSA Population - 1970-Present


Zip Codes in the St Louis Metro Area Where Homes Are Selling the Fastest

The St. Louis Metropolitan Area continues to enjoy a fairly fast-paced sellers real estate market, with certain zip codes standing out for selling even faster than the current norm.  According to the report below, available exclusively from MORE, REALTORS®, homes in the top 30 zip codes are selling at an impressive rate, with average days on market ranging from just 2 to 24 days.
Leading the pack is zip code 63049 in Jefferson and St. Louis Counties, Missouri, where homes spend an average of only 2 days on the market. Close behind are zip codes in St. Clair County, Illinois (62258) and Madison County, Illinois (62010), with average selling times of 6 and 7 days, respectively.

Other notable fast-selling areas include zip codes in Warren County, Missouri (63380), St. Louis City, Missouri (63141, 63109, 63147, 63139), and St. Charles County, Missouri (63304, 63385, 63367, 63376). These areas demonstrate the high demand and quick turnover that characterize the St. Louis real estate market.

For buyers, this data highlights the need to act quickly when a desirable property becomes available. Sellers, on the other hand, can take advantage of the fast-paced market to sell their homes efficiently and potentially secure a favorable price.

Understanding the dynamics of these fast-selling zip codes is crucial for anyone navigating the St. Louis real estate landscape. By staying informed and working with experienced professionals, both buyers and sellers can make the most of the opportunities presented by this thriving market.  Want to meet some of St Louis’ finest agents?  Then check them out here.


Fastest Selling Zip Codes In The St Louis MSA

(Click on table below to see current, live and complete list)

Fastest Selling Zip Codes In The St Louis MSA

St Louis New Home Constructions Begins 2024 Down From a Year Ago

In the 12-month period ended January 31, 2024 the St. Louis area saw the issuance of 3,996 building permits for new single-family homes. This represents a decline of 3.64% compared to the previous 12-month period, which had 4,147 permits, according to the latest figures from the Home Builders Association of St. Louis & Eastern Missouri (St. Louis HBA). This downward trend was noted across all counties with the exception of St. Charles County, with two counties reporting double-digit decreases.


St Louis New Home Building Permits – January 2024

(click on table below for page with live charts showing additional permit data)St Louis New Home Building Permits - January 2024


St. Louis MSA’s Population Dynamics Over 50 Years

As the table and charts below illustrate, the St. Louis Metropolitatn Area (MSA) has undergone significant demographic shifts over the past 50 years, marked by a stark contrast between the population trends in the City of St. Louis and its surrounding counties.

St Louis MSA and Major Counties Population 1970-2022

St Louis MSA Population 1970-Present Table

The decline in the City of St. Louis’s population sharply contrasts with the growth in surrounding counties. During the same period that St. Charles County witnessed a 345% increase and the St. Louis MSA as a whole saw nearly a 60% rise, the City of St. Louis experienced nearly a 70% drop in population.

Over the last 50 years, the St. Louis MSA has undergone significant shifts in its population, characterized by substantial declines in the City of St. Louis and remarkable growth in suburban counties. This trend can largely be attributed to a combination of factors, including urban blight, which is characterized by the deterioration and abandonment of buildings, leading to a diminished quality of life and decreased property values. The escalation of crime rates further compounded the city’s challenges, rendering it less appealing for families and individuals in search of safe, stable environments. Furthermore, governance issues, marked by inefficient public services and policies that failed to effectively address the needs of urban residents, have also contributed to the population decline. These factors, coupled with the allure of suburban living—offering more spacious living conditions, better educational facilities, and a perceived higher level of safety—have propelled the demographic shift away from the city center and towards the suburbs.

St Louis MSA and City of St Louis Population – 1970 – 2022 Chart

(click on chart for live interactive chart)

St Louis MSA and City of St Louis Population - 1970 - 2022 Chart

St Louis Major Counties Population- 1970 – 2022 Chart

(click on chart for live interactive chart)

St Louis Major Counties Population- 1970 - 2022 Chart


ext-align:

Despite High Demand and Low Inventory, St. Louis New Home Permits Hit Nine-Year Low in 2023

In 2023, the St. Louis area saw the issuance of 3,891 building permits for new single-family homes. This represents a decline of 10.78% compared to the previous year, which had 4,361 permits, according to the latest figures from the Home Builders Association of St. Louis & Eastern Missouri (St. Louis HBA). This downward trend was noted across all counties with the exception of St. Charles County, where five counties reported double-digit decreases. Additionally, Warren County, which had been on a four-month streak of increased permit activity, experienced a slight drop this month. The total of 3,891 permits in 2023 is the lowest the St. Louis area has seen since 2014, when 3,843 permits were issued. Furthermore, this total is nearly 17% below the 20-year average of 4,680 permits annually and 11% below the 20-year median of 4,375 permits.


St Louis New Home Building Permits – December 2023

(click on table below for page with live charts showing additional permit data)